
- Start >
- Rivers >
- Waterlevel >
- Untere Donau >
- Linden >
- Chart of year

Chart of year Linden / Rott
Waterlevel from 29.03.2024 to 28.03.2025
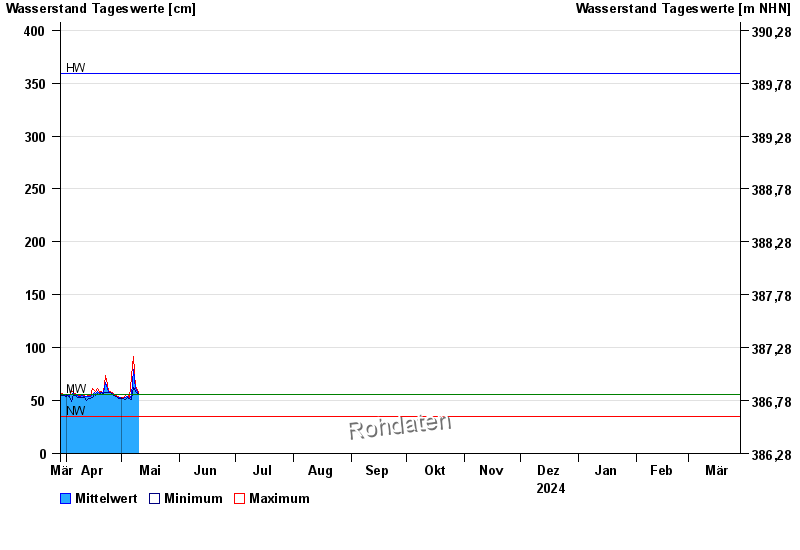
| Date | Mean value [cm] | Maximum [cm] | Minimum [cm] |
|---|---|---|---|
| 03.06.2024 | 101 | 102 | 99 |
| 02.06.2024 | 122 | 138 | 103 |
| 01.06.2024 | 117 | 139 | 97 |
| 31.05.2024 | 86 | 112 | 65 |
| 30.05.2024 | 63 | 71 | 58 |
| 29.05.2024 | 64 | 74 | 59 |
| 28.05.2024 | 69 | 77 | 54 |
© Bayerisches Landesamt für Umwelt 2024