
- Start >
- Rivers >
- Waterlevel >
- Untere Donau >
- Hörmannsberg >
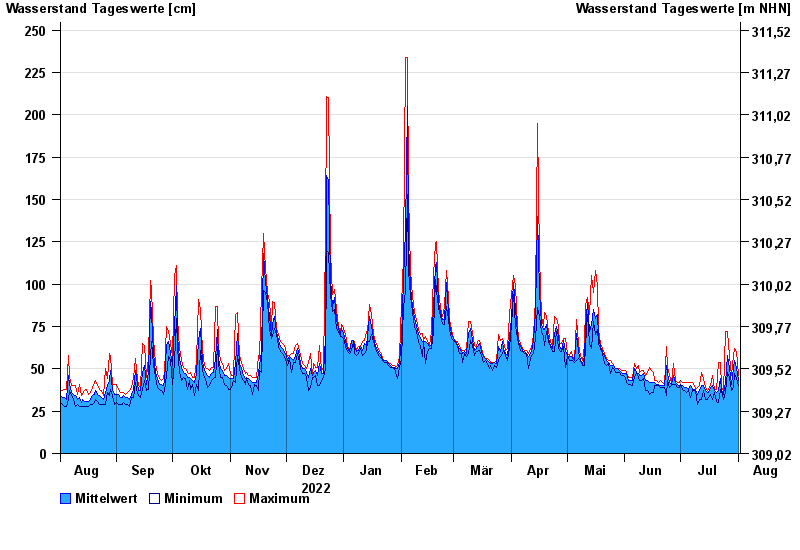
- Chart of year

Chart of year Hörmannsberg / Gaißa
Waterlevel from 02.08.2022 to 01.08.2023
| Date | Mean value [cm] | Maximum [cm] | Minimum [cm] |
|---|---|---|---|
| 01.08.2023 | 43 | 46 | 40 |
| 31.07.2023 | 51 | 60 | 44 |
| 30.07.2023 | 55 | 62 | 47 |
| 29.07.2023 | 50 | 58 | 39 |
| 28.07.2023 | 41 | 46 | 37 |
| 27.07.2023 | 50 | 57 | 45 |
| 26.07.2023 | 58 | 72 | 48 |
© Bayerisches Landesamt für Umwelt 2024