
- Start >
- Rivers >
- Waterlevel >
- Untere Donau >
- Hörmannsberg >
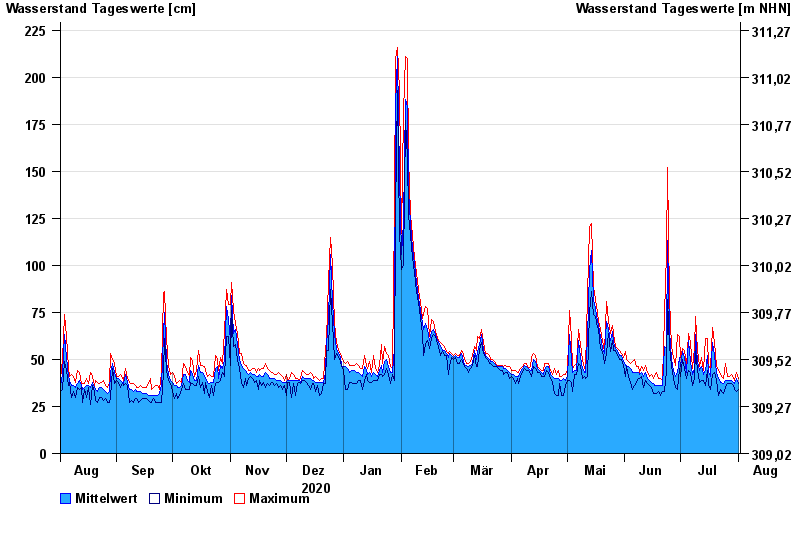
- Chart of year

Chart of year Hörmannsberg / Gaißa
Waterlevel from 02.08.2020 to 01.08.2021
| Date | Mean value [cm] | Maximum [cm] | Minimum [cm] |
|---|---|---|---|
| 01.08.2021 | 37 | 40 | 34 |
| 31.07.2021 | 40 | 43 | 33 |
| 30.07.2021 | 37 | 39 | 34 |
| 29.07.2021 | 38 | 40 | 36 |
| 28.07.2021 | 39 | 42 | 37 |
| 27.07.2021 | 39 | 41 | 37 |
| 26.07.2021 | 39 | 41 | 37 |
© Bayerisches Landesamt für Umwelt 2024