
- Start >
- Rivers >
- Waterlevel >
- Untere Donau >
- Hörmannsberg >
- Chart of year

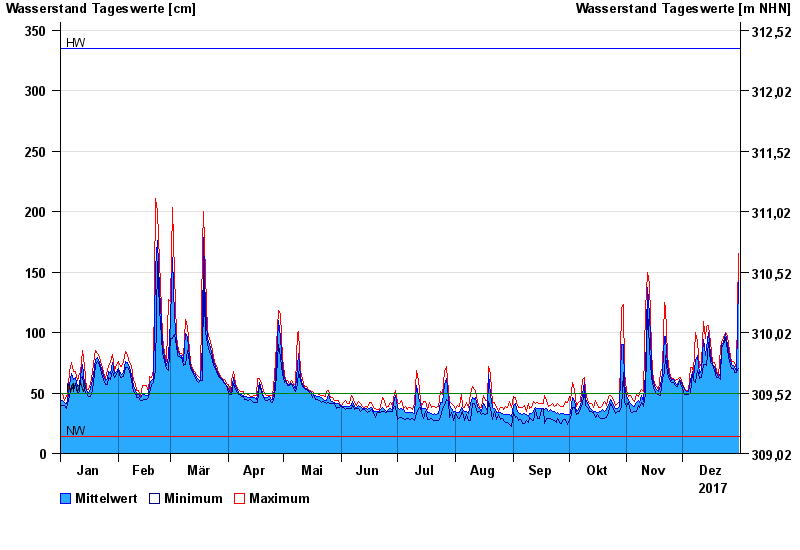
Chart of year Hörmannsberg / Gaißa
Waterlevel from 01.01.2017 to 31.12.2017
| Date | Mean value [cm] | Maximum [cm] | Minimum [cm] |
|---|---|---|---|
| 31.12.2017 | 142 | 165 | 70 |
| 30.12.2017 | 68 | 70 | 67 |
| 29.12.2017 | 71 | 75 | 67 |
| 28.12.2017 | 73 | 76 | 70 |
| 27.12.2017 | 74 | 76 | 70 |
| 26.12.2017 | 80 | 85 | 76 |
| 25.12.2017 | 90 | 97 | 85 |
© Bayerisches Landesamt für Umwelt 2024