
- Start >
- Rivers >
- Waterlevel >
- Untere Donau >
- Hörmannsberg >
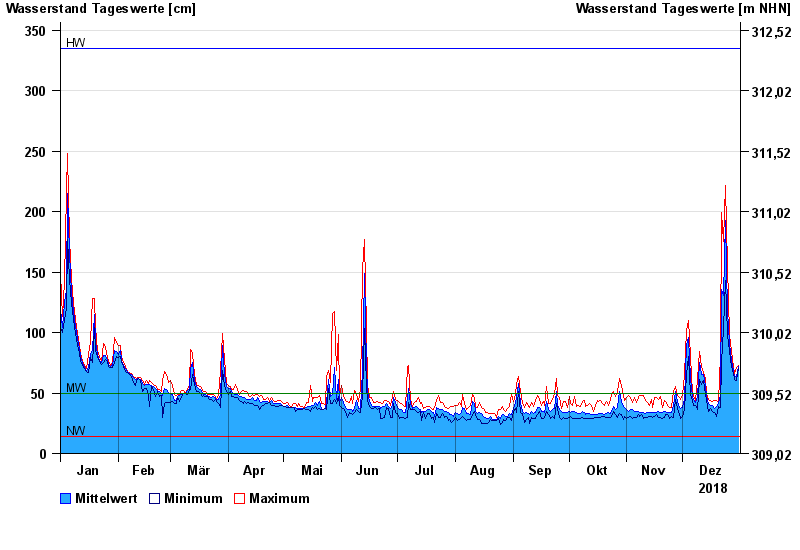
- Chart of year

Chart of year Hörmannsberg / Gaißa
Waterlevel from 01.01.2018 to 31.12.2018
| Date | Mean value [cm] | Maximum [cm] | Minimum [cm] |
|---|---|---|---|
| 31.12.2018 | 72 | 73 | 70 |
| 30.12.2018 | 64 | 71 | 60 |
| 29.12.2018 | 63 | 66 | 61 |
| 28.12.2018 | 69 | 72 | 66 |
| 27.12.2018 | 77 | 84 | 72 |
| 26.12.2018 | 91 | 98 | 84 |
| 25.12.2018 | 117 | 155 | 98 |
© Bayerisches Landesamt für Umwelt 2024