
- Start >
- Rivers >
- Waterlevel >
- Untere Donau >
- Hörmannsberg >
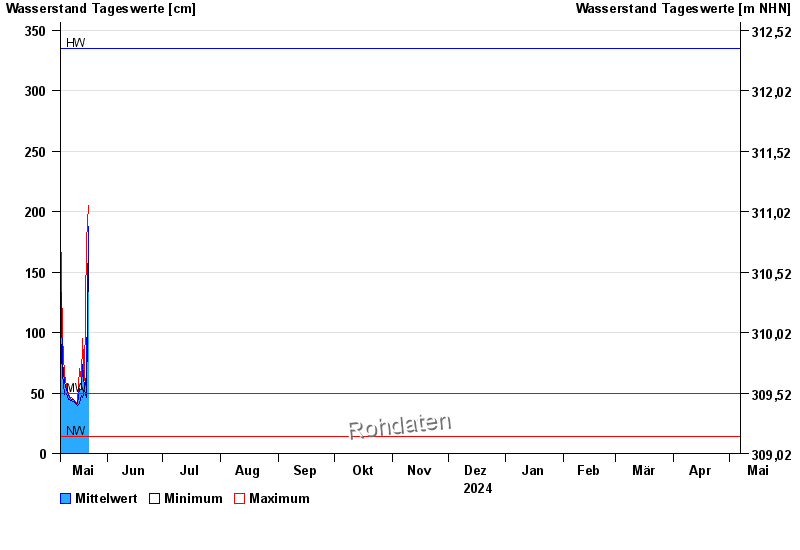
- Chart of year

Chart of year Hörmannsberg / Gaißa
Waterlevel from 07.05.2024 to 06.05.2025
| Date | Mean value [cm] | Maximum [cm] | Minimum [cm] |
|---|---|---|---|
| 01.06.2024 | 109 | 140 | 67 |
| 31.05.2024 | 64 | 67 | 60 |
| 30.05.2024 | 57 | 60 | 53 |
| 29.05.2024 | 61 | 67 | 56 |
| 28.05.2024 | 64 | 68 | 57 |
| 27.05.2024 | 59 | 70 | 46 |
| 26.05.2024 | 63 | 64 | 62 |
© Bayerisches Landesamt für Umwelt 2024