
- Start >
- Rivers >
- Waterlevel >
- Untere Donau >
- Grafenau >
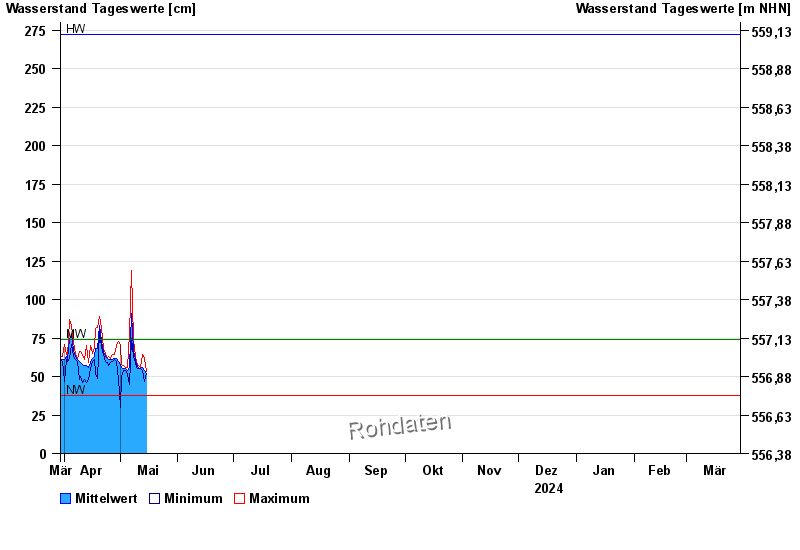
- Chart of year

Chart of year Grafenau / Kleine Ohe
Waterlevel from 30.03.2024 to 29.03.2025
| Date | Mean value [cm] | Maximum [cm] | Minimum [cm] |
|---|---|---|---|
| 29.05.2024 | 63 | 63 | 62 |
| 28.05.2024 | 64 | 67 | 59 |
| 27.05.2024 | 60 | 61 | 59 |
| 26.05.2024 | 62 | 66 | 54 |
| 25.05.2024 | 65 | 76 | 41 |
| 24.05.2024 | 70 | 74 | 68 |
| 23.05.2024 | 76 | 84 | 70 |
© Bayerisches Landesamt für Umwelt 2024