
- Start >
- Rivers >
- Waterlevel >
- Untere Donau >
- Eschlkam >
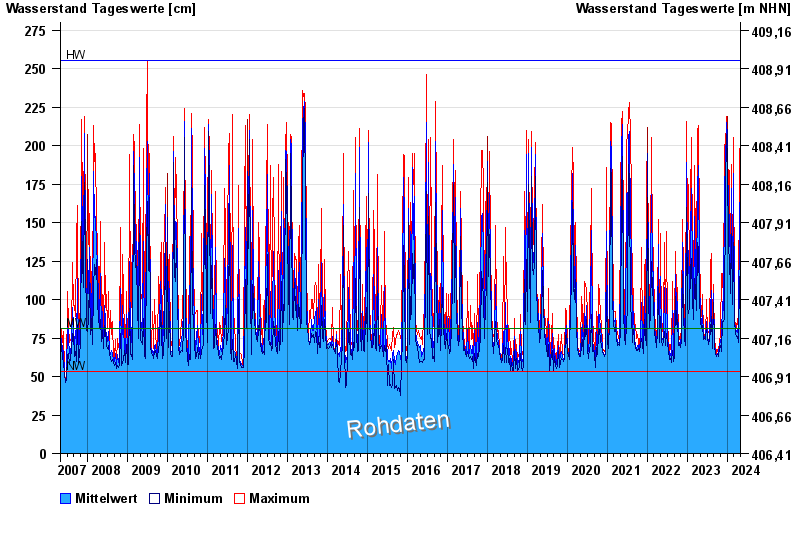
- Chart of total period

Chart of total period Eschlkam / Chamb
Waterlevel from 01.05.2007 to 29.04.2024
| Date | Mean value [cm] | Maximum [cm] | Minimum [cm] |
|---|---|---|---|
| 29.04.2024 | 76 | 77 | 75 |
| 28.04.2024 | 77 | 79 | 75 |
| 27.04.2024 | 79 | 81 | 78 |
| 26.04.2024 | 83 | 85 | 81 |
| 25.04.2024 | 84 | 86 | 83 |
| 24.04.2024 | 86 | 87 | 83 |
| 23.04.2024 | 90 | 94 | 87 |
© Bayerisches Landesamt für Umwelt 2024