
- Start >
- Rivers >
- Waterlevel >
- Untere Donau >
- Dietldorf >
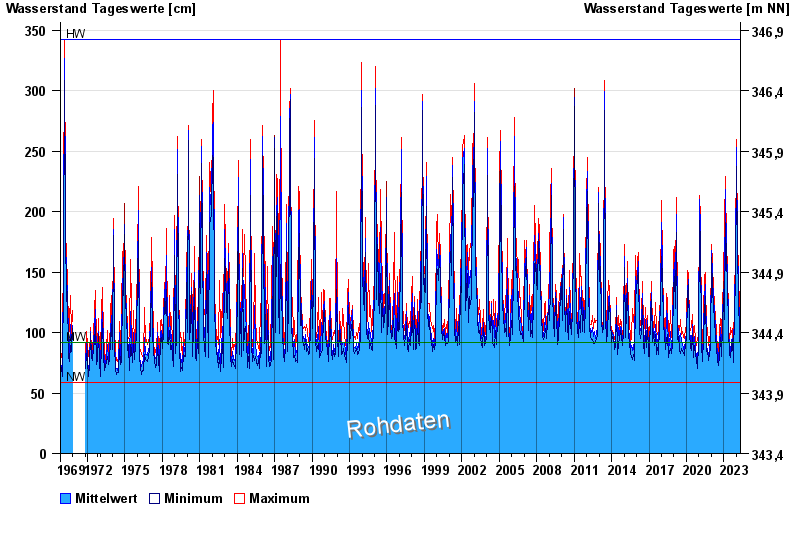
- Chart of total period

Chart of total period Dietldorf / Vils
Waterlevel from 01.11.1969 to 01.05.2024
| Date | Mean value [cm] | Maximum [cm] | Minimum [cm] |
|---|---|---|---|
| 01.05.2024 | 93 | 95 | 92 |
| 30.04.2024 | 94 | 103 | 83 |
| 29.04.2024 | 95 | 98 | 93 |
| 28.04.2024 | 97 | 104 | 86 |
| 27.04.2024 | 97 | 101 | 94 |
| 26.04.2024 | 100 | 108 | 89 |
| 25.04.2024 | 102 | 104 | 99 |
© Bayerisches Landesamt für Umwelt 2024