
- Start >
- Rivers >
- Waterlevel >
- Untere Donau >
- Deggendorf >
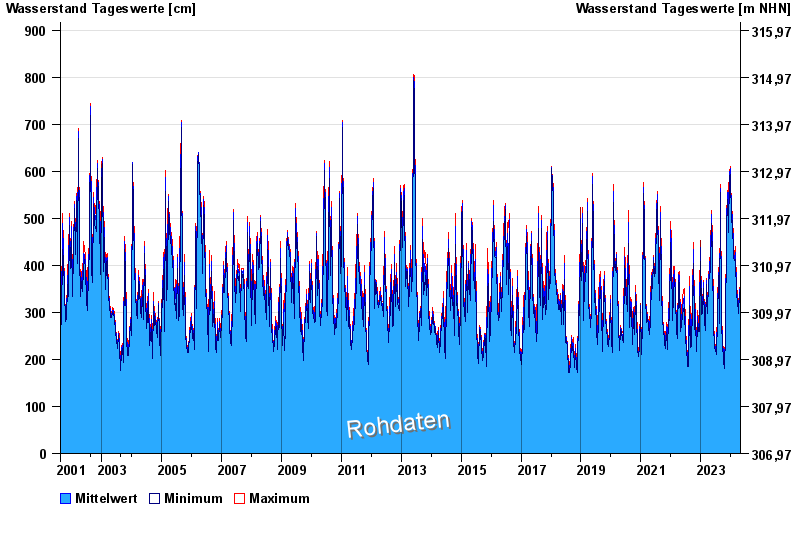
- Chart of total period

Chart of total period Deggendorf / Donau
Waterlevel from 16.08.2001 to 29.04.2024
| Date | Mean value [cm] | Maximum [cm] | Minimum [cm] |
|---|---|---|---|
| 29.04.2024 | 287 | 297 | 280 |
| 28.04.2024 | 290 | 292 | 287 |
| 27.04.2024 | 292 | 298 | 289 |
| 26.04.2024 | 299 | 304 | 294 |
| 25.04.2024 | 308 | 313 | 303 |
| 24.04.2024 | 324 | 333 | 313 |
| 23.04.2024 | 340 | 342 | 333 |
© Bayerisches Landesamt für Umwelt 2024