
- Start >
- Rivers >
- Waterlevel >
- Untere Donau >
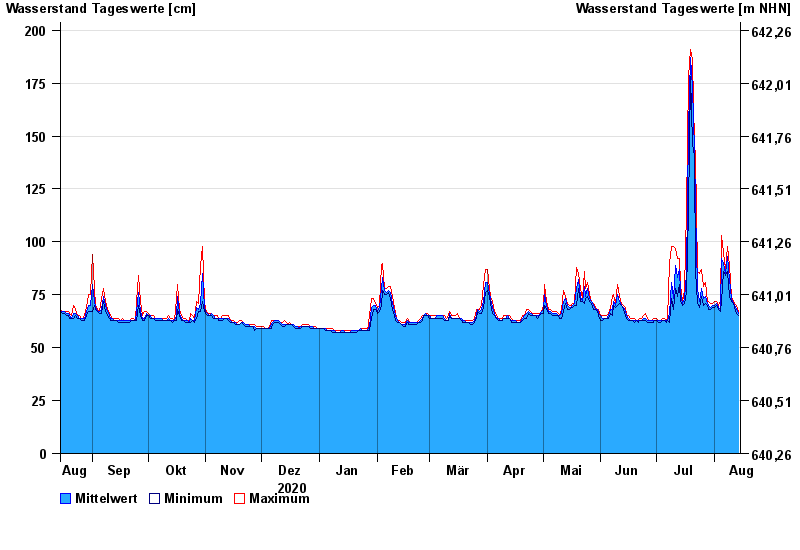
- Bad Tölz Brücke >
- Chart of year

Chart of year Bad Tölz Brücke / Isar
Waterlevel from 15.08.2020 to 14.08.2021
- 23.08.2005 Wasserstand: 371 cm
- 22.05.1999 Wasserstand: 318 cm
- 02.06.2013 Wasserstand: 276 cm
- 30.08.1995 Wasserstand: 274 cm
- 03.06.2010 Wasserstand: 257 cm
| Date | Mean value [cm] | Maximum [cm] | Minimum [cm] |
|---|---|---|---|
| 14.08.2021 | 66 | 67 | 65 |
| 13.08.2021 | 68 | 70 | 66 |
| 12.08.2021 | 70 | 71 | 69 |
| 11.08.2021 | 71 | 72 | 71 |
| 10.08.2021 | 73 | 74 | 72 |
| 09.08.2021 | 82 | 89 | 74 |
| 08.08.2021 | 93 | 98 | 86 |
© Bayerisches Landesamt für Umwelt 2024