
- Start >
- Rivers >
- Waterlevel >
- Naab - Regen >
- Weiden >
- Chart of year

Chart of year Weiden / Waldnaab
Waterlevel from 27.10.2023 to 26.10.2024
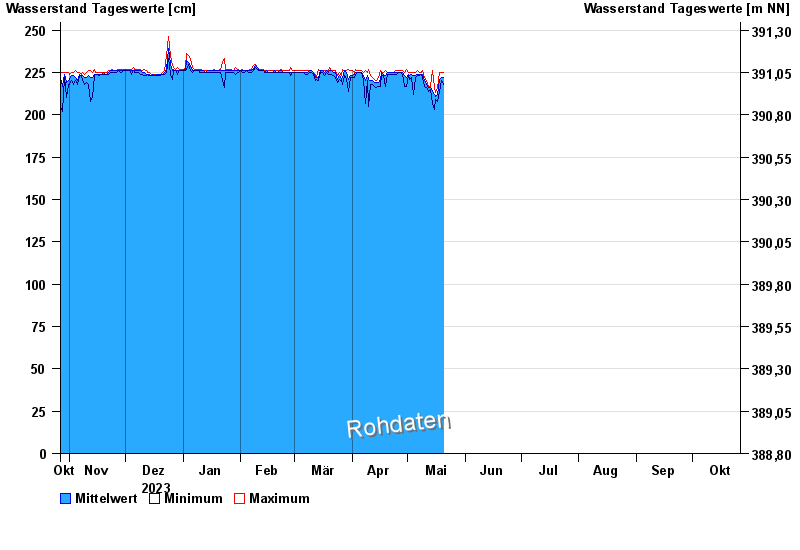
| Date | Mean value [cm] | Maximum [cm] | Minimum [cm] |
|---|---|---|---|
| 17.05.2024 | 211 | 212 | 211 |
| 16.05.2024 | 211 | 213 | 209 |
| 15.05.2024 | 212 | 216 | 203 |
| 14.05.2024 | 214 | 226 | 207 |
| 13.05.2024 | 216 | 217 | 215 |
| 12.05.2024 | 216 | 217 | 214 |
| 11.05.2024 | 218 | 220 | 216 |
© Bayerisches Landesamt für Umwelt 2024