
- Start >
- Rivers >
- Waterlevel >
- Naab - Regen >
- Unterköblitz >
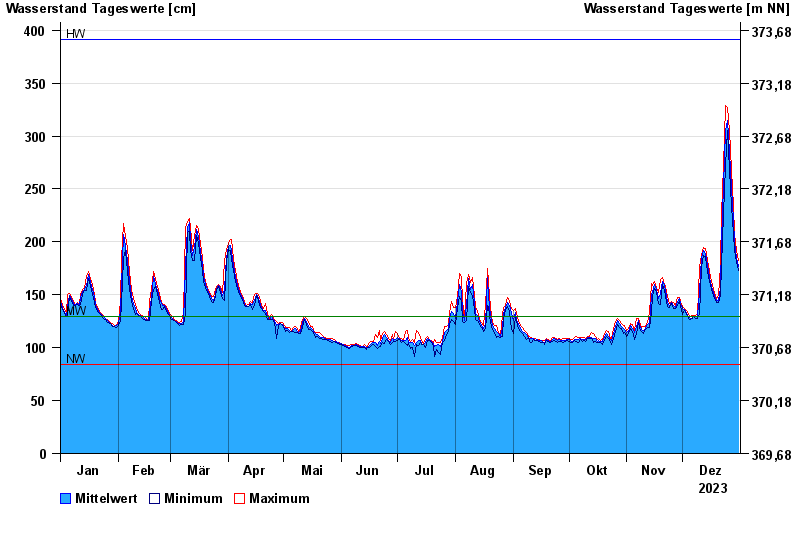
- Chart of year

Chart of year Unterköblitz / Naab
Waterlevel from 01.01.2023 to 31.12.2023
| Date | Mean value [cm] | Maximum [cm] | Minimum [cm] |
|---|---|---|---|
| 31.12.2023 | 177 | 182 | 173 |
| 30.12.2023 | 185 | 192 | 181 |
| 29.12.2023 | 199 | 208 | 192 |
| 28.12.2023 | 220 | 233 | 208 |
| 27.12.2023 | 250 | 267 | 233 |
| 26.12.2023 | 285 | 305 | 267 |
| 25.12.2023 | 315 | 327 | 305 |
© Bayerisches Landesamt für Umwelt 2024