
- Start >
- Rivers >
- Waterlevel >
- Naab - Regen >
- Unterköblitz >
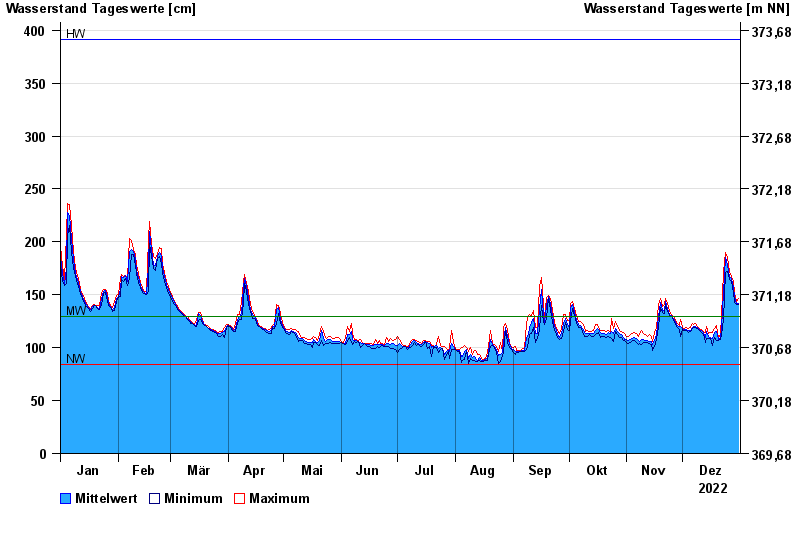
- Chart of year

Chart of year Unterköblitz / Naab
Waterlevel from 01.01.2022 to 31.12.2022
| Date | Mean value [cm] | Maximum [cm] | Minimum [cm] |
|---|---|---|---|
| 31.12.2022 | 142 | 146 | 141 |
| 30.12.2022 | 142 | 144 | 141 |
| 29.12.2022 | 148 | 152 | 143 |
| 28.12.2022 | 157 | 163 | 152 |
| 27.12.2022 | 165 | 167 | 163 |
| 26.12.2022 | 167 | 172 | 164 |
| 25.12.2022 | 178 | 185 | 172 |
© Bayerisches Landesamt für Umwelt 2024