
- Start >
- Rivers >
- Waterlevel >
- Naab - Regen >
- Unterköblitz >
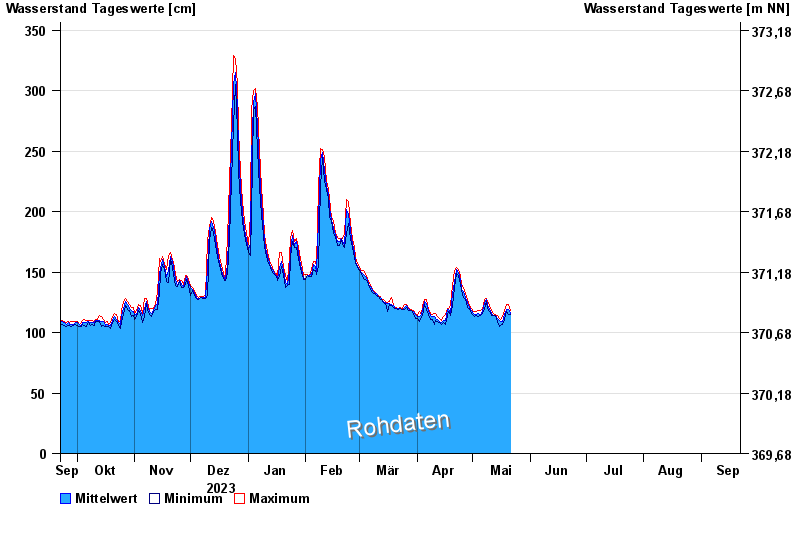
- Chart of year

Chart of year Unterköblitz / Naab
Waterlevel from 22.09.2023 to 21.09.2024
| Date | Mean value [cm] | Maximum [cm] | Minimum [cm] |
|---|---|---|---|
| 24.05.2024 | 155 | 156 | 154 |
| 23.05.2024 | 163 | 172 | 156 |
| 22.05.2024 | 147 | 172 | 125 |
| 21.05.2024 | 117 | 125 | 115 |
| 20.05.2024 | 119 | 123 | 115 |
| 19.05.2024 | 119 | 123 | 117 |
| 18.05.2024 | 115 | 118 | 111 |
© Bayerisches Landesamt für Umwelt 2024