
- Start >
- Rivers >
- Waterlevel >
- Naab - Regen >
- Unterköblitz >
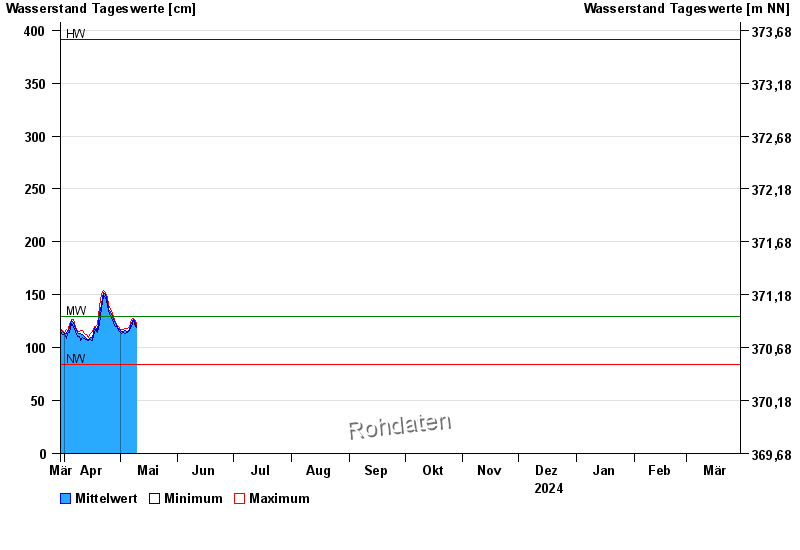
- Chart of year

Chart of year Unterköblitz / Naab
Waterlevel from 30.03.2024 to 29.03.2025
| Date | Mean value [cm] | Maximum [cm] | Minimum [cm] |
|---|---|---|---|
| 29.05.2024 | 164 | 165 | 161 |
| 28.05.2024 | 149 | 165 | 137 |
| 27.05.2024 | 143 | 149 | 137 |
| 26.05.2024 | 152 | 160 | 143 |
| 25.05.2024 | 146 | 153 | 143 |
| 24.05.2024 | 155 | 156 | 153 |
| 23.05.2024 | 163 | 172 | 156 |
© Bayerisches Landesamt für Umwelt 2024