
- Start >
- Rivers >
- Waterlevel >
- Naab - Regen >
- Unterbruck Flutmulde >
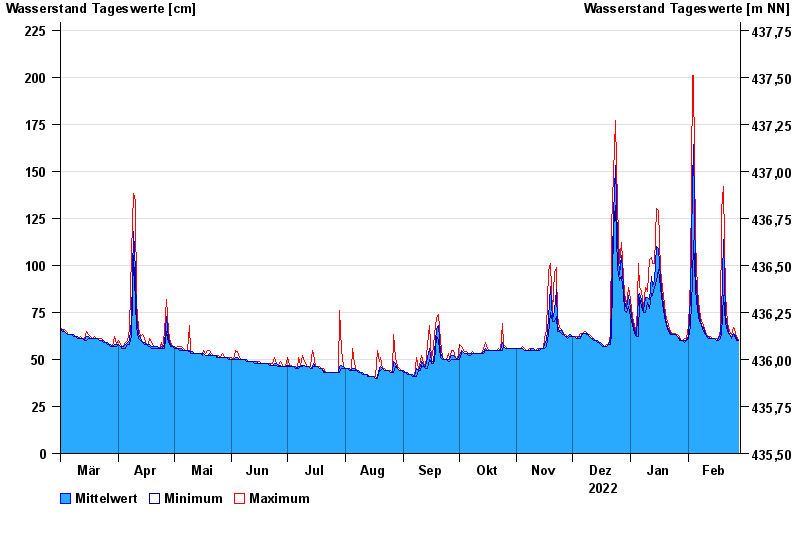
- Chart of year

Chart of year Unterbruck Flutmulde / Haidenaab
Waterlevel from 01.03.2022 to 28.02.2023
| Date | Mean value [cm] | Maximum [cm] | Minimum [cm] |
|---|---|---|---|
| 28.02.2023 | 60 | 60 | 60 |
| 27.02.2023 | 61 | 62 | 60 |
| 26.02.2023 | 63 | 66 | 62 |
| 25.02.2023 | 64 | 67 | 63 |
| 24.02.2023 | 62 | 63 | 61 |
| 23.02.2023 | 63 | 65 | 63 |
| 22.02.2023 | 67 | 69 | 65 |
© Bayerisches Landesamt für Umwelt 2024