
- Start >
- Rivers >
- Waterlevel >
- Naab - Regen >
- Unterbruck Flutmulde >
- Chart of year

Chart of year Unterbruck Flutmulde / Haidenaab
Waterlevel from 18.04.2024 to 17.04.2025
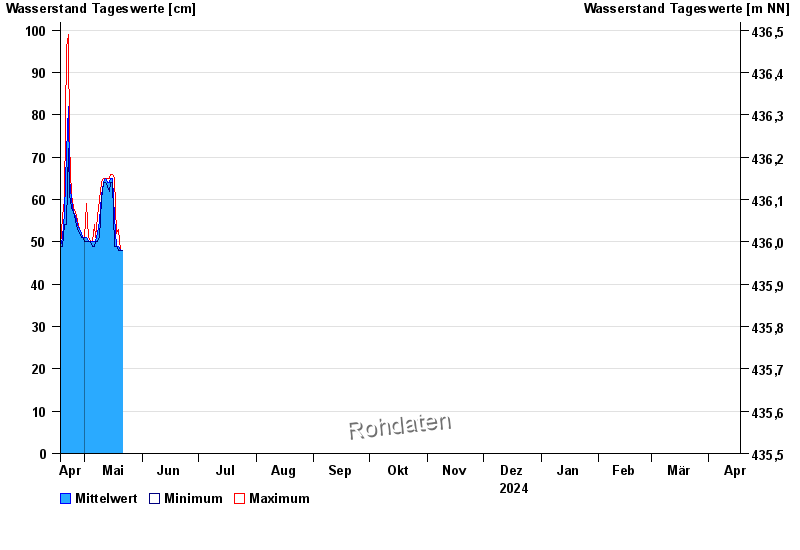
| Date | Mean value [cm] | Maximum [cm] | Minimum [cm] |
|---|---|---|---|
| 21.05.2024 | 48 | 48 | 48 |
| 20.05.2024 | 48 | 48 | 48 |
| 19.05.2024 | 49 | 53 | 48 |
| 18.05.2024 | 49 | 52 | 49 |
| 17.05.2024 | 56 | 65 | 49 |
| 16.05.2024 | 65 | 66 | 64 |
| 15.05.2024 | 65 | 66 | 64 |
© Bayerisches Landesamt für Umwelt 2024