
- Start >
- Rivers >
- Waterlevel >
- Naab - Regen >
- Unterbruck >
- Chart of year

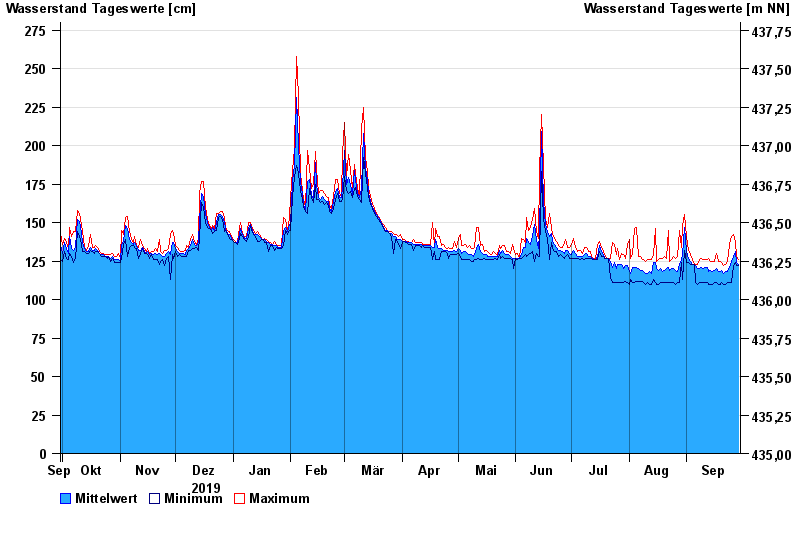
Chart of year Unterbruck / Haidenaab
Waterlevel from 30.09.2019 to 29.09.2020
- 14.01.2011 Wasserstand: 290 cm
- 23.12.2012 Wasserstand: 289 cm
- 28.05.2006 Wasserstand: 288 cm
- 13.02.2005 Wasserstand: 288 cm
- 21.12.1993 Wasserstand: 285 cm
| Date | Mean value [cm] | Maximum [cm] | Minimum [cm] |
|---|---|---|---|
| 29.09.2020 | 123 | 126 | 122 |
| 28.09.2020 | 124 | 128 | 122 |
| 27.09.2020 | 131 | 137 | 124 |
| 26.09.2020 | 128 | 142 | 122 |
| 25.09.2020 | 125 | 141 | 111 |
| 24.09.2020 | 121 | 136 | 111 |
| 23.09.2020 | 118 | 125 | 111 |
© Bayerisches Landesamt für Umwelt 2024