
- Start >
- Rivers >
- Waterlevel >
- Naab - Regen >
- Trausnitz u. d. Mühle >
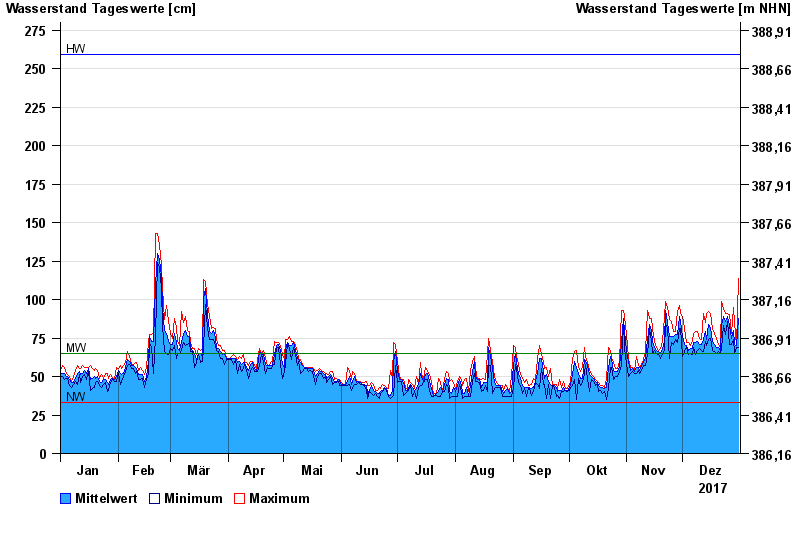
- Chart of year

Chart of year Trausnitz u. d. Mühle / Pfreimd
Waterlevel from 01.01.2017 to 31.12.2017
| Date | Mean value [cm] | Maximum [cm] | Minimum [cm] |
|---|---|---|---|
| 31.12.2017 | 88 | 114 | 69 |
| 30.12.2017 | 70 | 70 | 69 |
| 29.12.2017 | 71 | 85 | 65 |
| 28.12.2017 | 80 | 95 | 74 |
| 27.12.2017 | 75 | 78 | 71 |
| 26.12.2017 | 83 | 90 | 71 |
| 25.12.2017 | 89 | 91 | 86 |
© Bayerisches Landesamt für Umwelt 2024