
- Start >
- Rivers >
- Waterlevel >
- Naab - Regen >
- Schwandorf >
- Chart of year

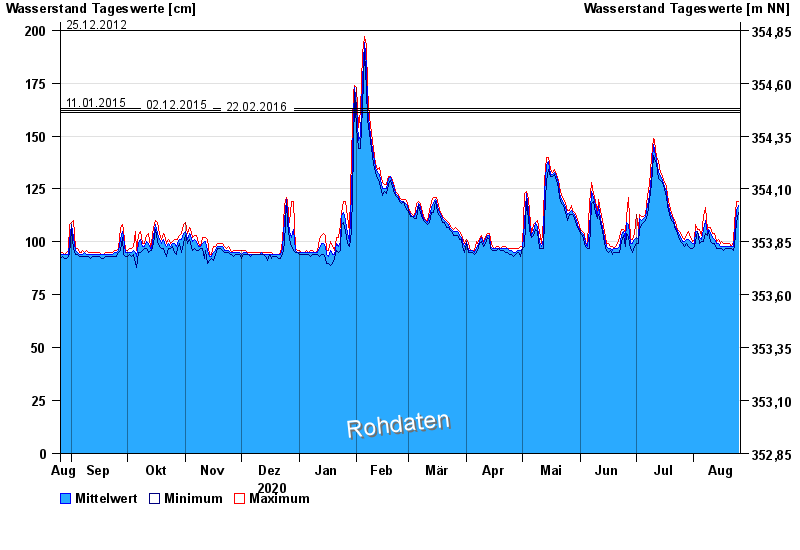
Chart of year Schwandorf / Naab
Waterlevel from 26.08.2020 to 25.08.2021
note
Pegel bis auf Weiteres außer Betrieb wegen Brückenbauarbeiten.
- 04.06.2013 Wasserstand: 239 cm
- 25.12.2012 Wasserstand: 200 cm
- 11.01.2015 Wasserstand: 163 cm
- 02.12.2015 Wasserstand: 162 cm
- 22.02.2016 Wasserstand: 161 cm
| Date | Mean value [cm] | Maximum [cm] | Minimum [cm] |
|---|---|---|---|
| 25.08.2021 | 117 | 119 | 114 |
| 24.08.2021 | 115 | 119 | 109 |
| 23.08.2021 | 103 | 109 | 98 |
| 22.08.2021 | 98 | 100 | 96 |
| 21.08.2021 | 98 | 98 | 97 |
| 20.08.2021 | 98 | 99 | 97 |
| 19.08.2021 | 98 | 99 | 97 |
© Bayerisches Landesamt für Umwelt 2024