
- Start >
- Rivers >
- Waterlevel >
- Naab - Regen >
- Pulling >
- Chart of year

Chart of year Pulling / Regen
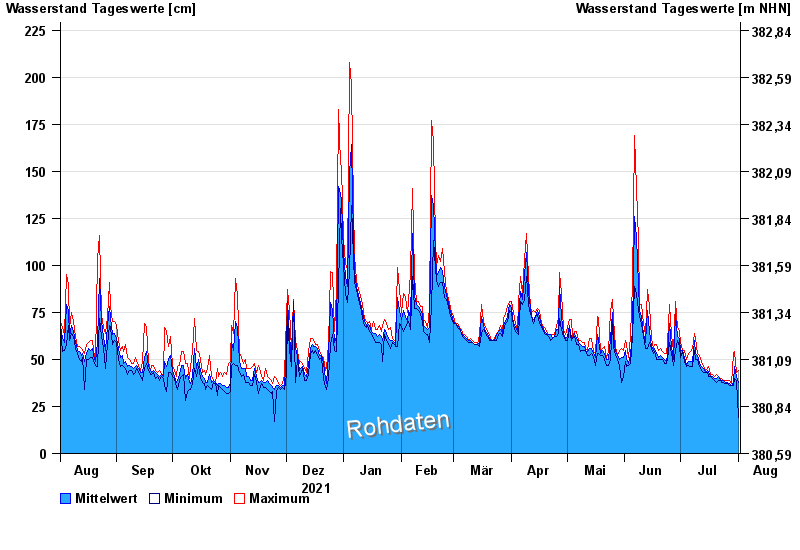
Waterlevel from 02.08.2021 to 01.08.2022
- 13.08.2002 Wasserstand: 437 cm
- 22.07.1980 Wasserstand: 374 cm
- 21.12.1993 Wasserstand: 358 cm
- 30.06.1966 Wasserstand: 340 cm
- 01.11.1998 Wasserstand: 327 cm
| Date | Mean value [cm] | Maximum [cm] | Minimum [cm] |
|---|---|---|---|
| 01.08.2022 | 38 | 44 | 19 |
| 31.07.2022 | 41 | 43 | 39 |
| 30.07.2022 | 46 | 54 | 40 |
| 29.07.2022 | 38 | 53 | 36 |
| 28.07.2022 | 36 | 37 | 36 |
| 27.07.2022 | 37 | 39 | 36 |
| 26.07.2022 | 38 | 39 | 37 |
© Bayerisches Landesamt für Umwelt 2024