
- Start >
- Rivers >
- Waterlevel >
- Naab - Regen >
- Pulling >
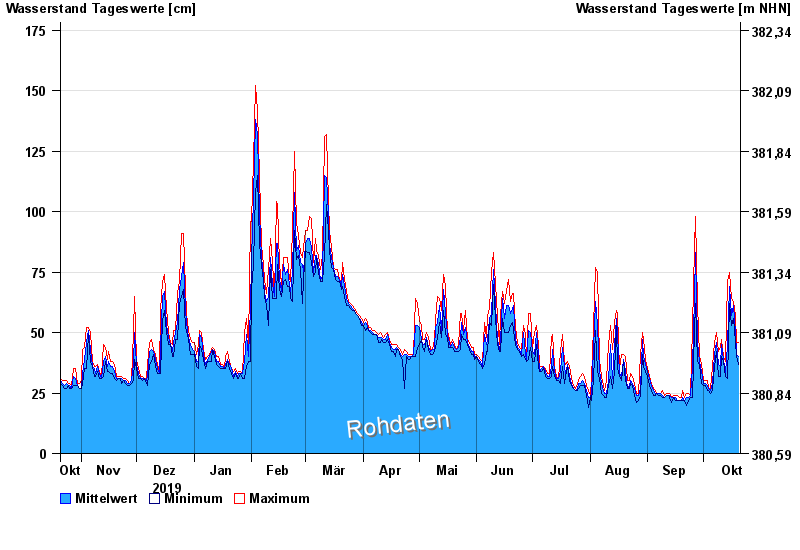
- Chart of year

Chart of year Pulling / Regen
Waterlevel from 21.10.2019 to 20.10.2020
- 13.08.2002 Wasserstand: 437 cm
- 22.07.1980 Wasserstand: 374 cm
- 21.12.1993 Wasserstand: 358 cm
- 30.06.1966 Wasserstand: 340 cm
- 01.11.1998 Wasserstand: 327 cm
| Date | Mean value [cm] | Maximum [cm] | Minimum [cm] |
|---|---|---|---|
| 20.10.2020 | 40 | 46 | 37 |
| 19.10.2020 | 41 | 46 | 40 |
| 18.10.2020 | 50 | 57 | 46 |
| 17.10.2020 | 61 | 63 | 56 |
| 16.10.2020 | 57 | 64 | 53 |
| 15.10.2020 | 69 | 75 | 62 |
| 14.10.2020 | 45 | 71 | 31 |
© Bayerisches Landesamt für Umwelt 2024