
- Start >
- Rivers >
- Waterlevel >
- Naab - Regen >
- Obersdorf >
- Chart of year

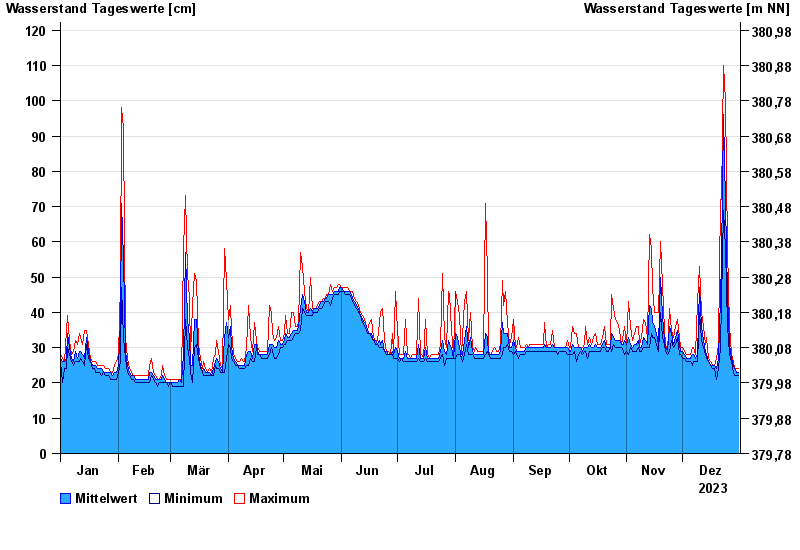
Chart of year Obersdorf / Rosenbach
Waterlevel from 01.01.2023 to 31.12.2023
- 26.01.1995 Wasserstand: 142 cm
- 31.07.2002 Wasserstand: 135 cm
- 13.01.2011 Wasserstand: 134 cm
- 03.01.2003 Wasserstand: 134 cm
- 21.12.1993 Wasserstand: 131 cm
| Date | Mean value [cm] | Maximum [cm] | Minimum [cm] |
|---|---|---|---|
| 31.12.2023 | 23 | 24 | 22 |
| 30.12.2023 | 23 | 24 | 22 |
| 29.12.2023 | 24 | 24 | 22 |
| 28.12.2023 | 25 | 26 | 23 |
| 27.12.2023 | 27 | 28 | 26 |
| 26.12.2023 | 31 | 36 | 28 |
| 25.12.2023 | 45 | 58 | 36 |
© Bayerisches Landesamt für Umwelt 2024