
- Start >
- Rivers >
- Waterlevel >
- Naab - Regen >
- Obersdorf >
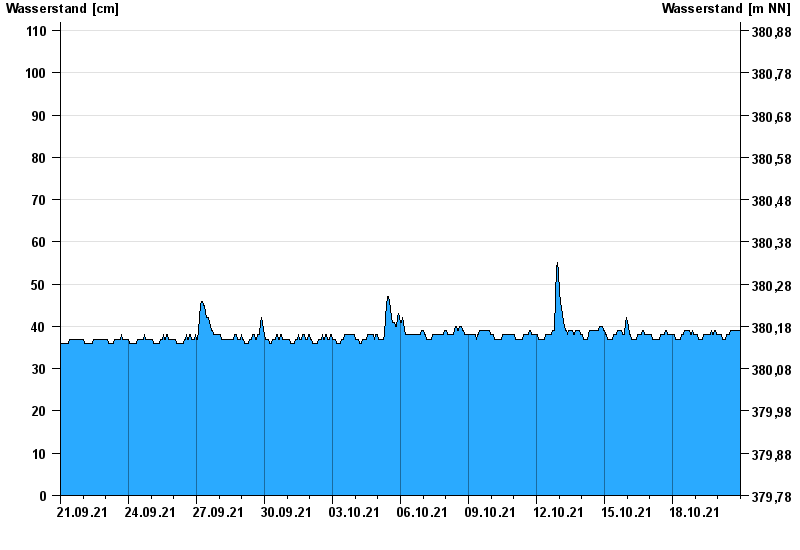
- Chart of month

Chart of month Obersdorf / Rosenbach
Waterlevel from 21.09.2021 to 20.10.2021
- 26.01.1995 Wasserstand: 142 cm
- 31.07.2002 Wasserstand: 135 cm
- 13.01.2011 Wasserstand: 134 cm
- 03.01.2003 Wasserstand: 134 cm
- 21.12.1993 Wasserstand: 131 cm
| Date | Waterlevel [cm] |
|---|---|
| 21.10.2021 00:45 | 38 |
| 21.10.2021 00:30 | 38 |
| 21.10.2021 00:15 | 38 |
| 21.10.2021 00:00 | 38 |
| 20.10.2021 23:45 | 39 |
| 20.10.2021 23:30 | 39 |
| 20.10.2021 23:15 | 39 |
© Bayerisches Landesamt für Umwelt 2024