
- Start >
- Rivers >
- Waterlevel >
- Naab - Regen >
- Neustadt >
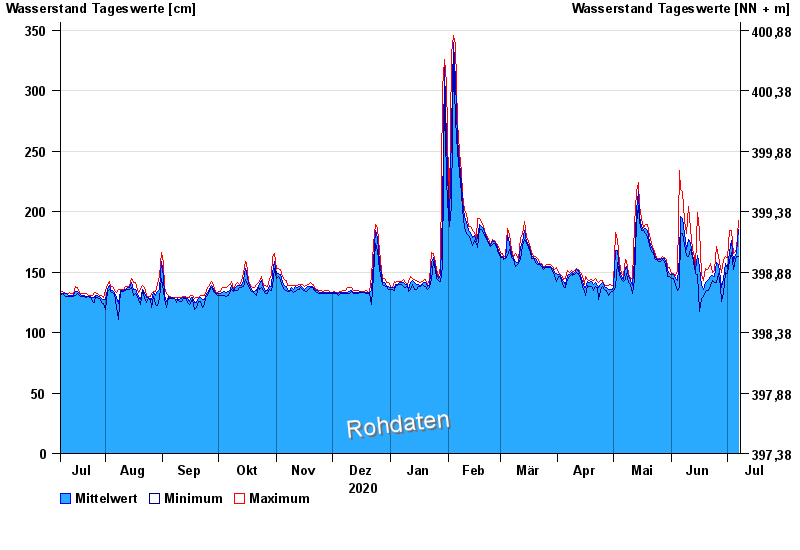
- Chart of year

Chart of year Neustadt / Waldnaab
Waterlevel from 08.07.2020 to 07.07.2021
- 28.05.2006 Wasserstand: 395 cm
- 02.02.1985 Wasserstand: 381 cm
- 01.11.1998 Wasserstand: 379 cm
- 26.01.1995 Wasserstand: 379 cm
- 30.12.1986 Wasserstand: 378 cm
| Date | Mean value [cm] | Maximum [cm] | Minimum [cm] |
|---|---|---|---|
| 07.07.2021 | 185 | 193 | 163 |
| 06.07.2021 | 166 | 169 | 163 |
| 05.07.2021 | 162 | 166 | 156 |
| 04.07.2021 | 159 | 165 | 152 |
| 03.07.2021 | 176 | 184 | 166 |
| 02.07.2021 | 166 | 184 | 159 |
| 01.07.2021 | 153 | 162 | 149 |
© Bayerisches Landesamt für Umwelt 2024