
- Start >
- Rivers >
- Waterlevel >
- Naab - Regen >
- Lorenzreuth >
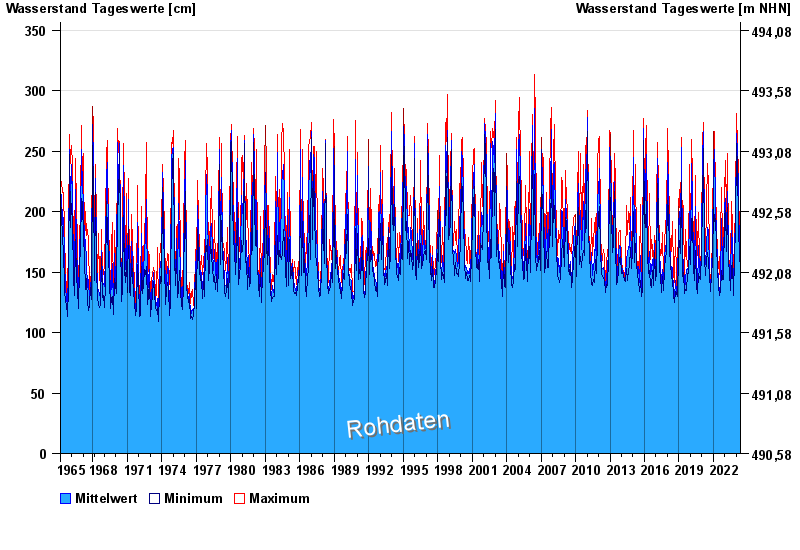
- Chart of total period

Chart of total period Lorenzreuth / Röslau
Waterlevel from 08.03.1965 to 09.05.2024
| Date | Mean value [cm] | Maximum [cm] | Minimum [cm] |
|---|---|---|---|
| 09.05.2024 | 149 | 150 | 148 |
| 08.05.2024 | 154 | 158 | 150 |
| 07.05.2024 | 159 | 162 | 157 |
| 06.05.2024 | 148 | 159 | 142 |
| 05.05.2024 | 142 | 152 | 139 |
| 04.05.2024 | 140 | 141 | 139 |
| 03.05.2024 | 141 | 145 | 139 |
© Bayerisches Landesamt für Umwelt 2024