
- Start >
- Rivers >
- Waterlevel >
- Naab - Regen >
- Lohberg >
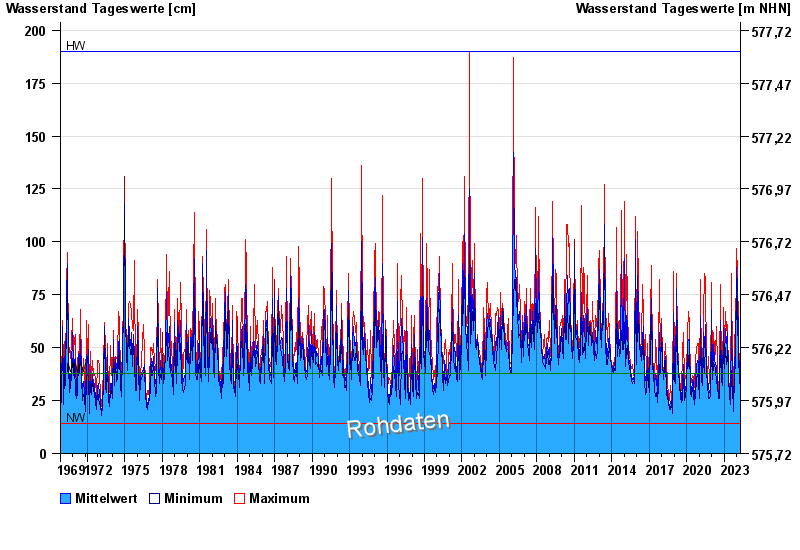
- Chart of total period

Chart of total period Lohberg / Weißer Regen
Waterlevel from 01.11.1969 to 26.04.2024
| Date | Mean value [cm] | Maximum [cm] | Minimum [cm] |
|---|---|---|---|
| 26.04.2024 | 27 | 27 | 26 |
| 25.04.2024 | 27 | 28 | 27 |
| 24.04.2024 | 27 | 28 | 27 |
| 23.04.2024 | 28 | 28 | 27 |
| 22.04.2024 | 28 | 29 | 28 |
| 21.04.2024 | 30 | 31 | 29 |
| 20.04.2024 | 32 | 33 | 31 |
© Bayerisches Landesamt für Umwelt 2024