
- Start >
- Rivers >
- Waterlevel >
- Naab - Regen >
- Liebenstein Werksabfluss >
- Chart of total period

Chart of total period Liebenstein Werksabfluss / Tirschenreuther Waldnaab
Waterlevel from 01.02.1968 to 26.04.2024
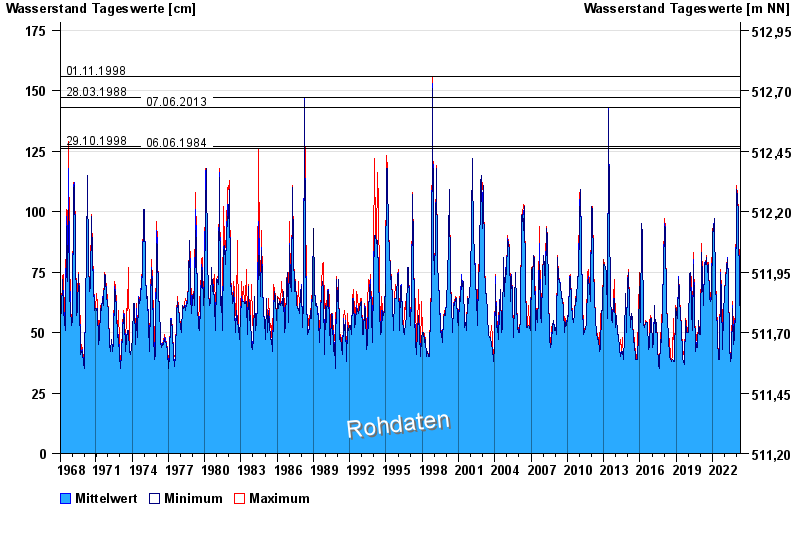
- 01.11.1998 Wasserstand: 156 cm
- 28.03.1988 Wasserstand: 147 cm
- 07.06.2013 Wasserstand: 143 cm
- 29.10.1998 Wasserstand: 127 cm
- 06.06.1984 Wasserstand: 126 cm
| Date | Mean value [cm] | Maximum [cm] | Minimum [cm] |
|---|---|---|---|
| 26.04.2024 | 58 | 69 | 55 |
| 25.04.2024 | 59 | 73 | 57 |
| 24.04.2024 | 59 | 65 | 56 |
| 23.04.2024 | 59 | 66 | 58 |
| 22.04.2024 | 57 | 60 | 53 |
| 21.04.2024 | 54 | 55 | 53 |
| 20.04.2024 | 53 | 54 | 52 |
© Bayerisches Landesamt für Umwelt 2024