
- Start >
- Rivers >
- Waterlevel >
- Naab - Regen >
- Leming >
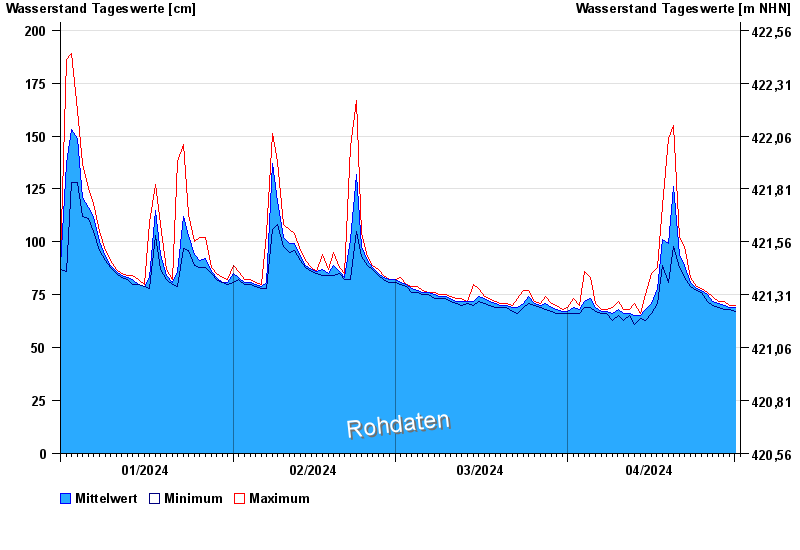
- Chart of year

Chart of year Leming / Freybach
Waterlevel from 01.01.2024 to 01.05.2024
| Date | Mean value [cm] | Maximum [cm] | Minimum [cm] |
|---|---|---|---|
| 01.05.2024 | 68 | 68 | 68 |
| 30.04.2024 | 69 | 70 | 68 |
| 29.04.2024 | 70 | 72 | 68 |
| 28.04.2024 | 71 | 72 | 69 |
| 27.04.2024 | 72 | 74 | 70 |
| 26.04.2024 | 75 | 76 | 72 |
| 25.04.2024 | 77 | 78 | 76 |
© Bayerisches Landesamt für Umwelt 2024