
- Start >
- Rivers >
- Waterlevel >
- Naab - Regen >
- Langenbruck >
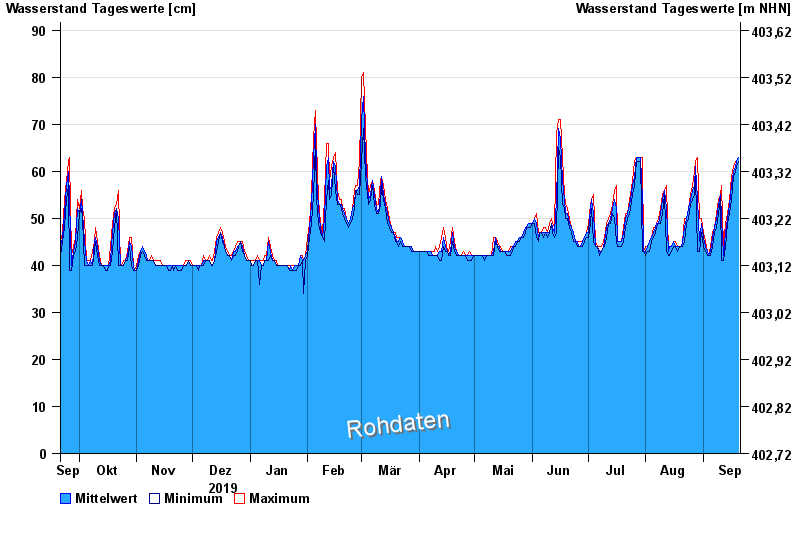
- Chart of year

Chart of year Langenbruck / Frankenohe
Waterlevel from 21.09.2019 to 20.09.2020
- 26.01.1995 Wasserstand: 193 cm
- 21.12.1993 Wasserstand: 181 cm
- 14.01.2011 Wasserstand: 176 cm
- 03.01.2003 Wasserstand: 174 cm
- 01.03.1990 Wasserstand: 172 cm
| Date | Mean value [cm] | Maximum [cm] | Minimum [cm] |
|---|---|---|---|
| 20.09.2020 | 63 | 63 | 62 |
| 19.09.2020 | 62 | 62 | 61 |
| 18.09.2020 | 61 | 62 | 60 |
| 17.09.2020 | 60 | 61 | 59 |
| 16.09.2020 | 57 | 59 | 54 |
| 15.09.2020 | 53 | 54 | 51 |
| 14.09.2020 | 50 | 51 | 49 |
© Bayerisches Landesamt für Umwelt 2024