
- Start >
- Rivers >
- Waterlevel >
- Naab - Regen >
- Langenbruck >
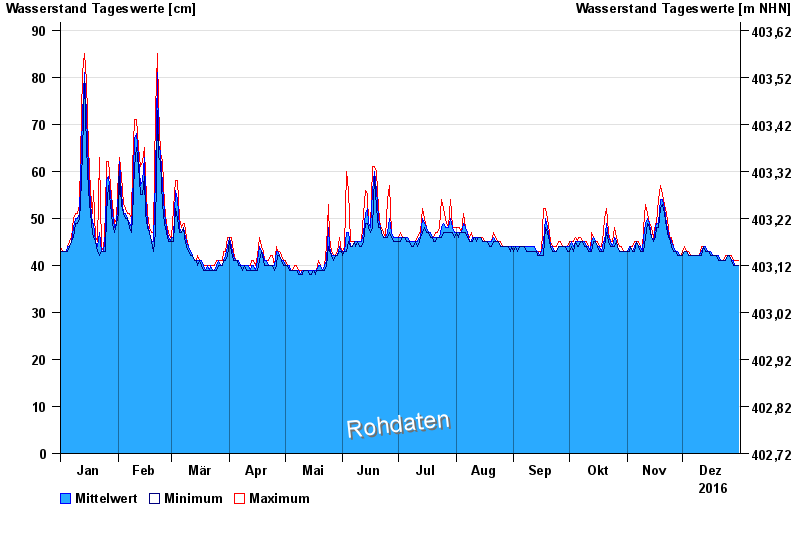
- Chart of year

Chart of year Langenbruck / Frankenohe
Waterlevel from 01.01.2016 to 31.12.2016
- 26.01.1995 Wasserstand: 193 cm
- 21.12.1993 Wasserstand: 181 cm
- 14.01.2011 Wasserstand: 176 cm
- 03.01.2003 Wasserstand: 174 cm
- 01.03.1990 Wasserstand: 172 cm
| Date | Mean value [cm] | Maximum [cm] | Minimum [cm] |
|---|---|---|---|
| 31.12.2016 | 40 | 41 | 40 |
| 30.12.2016 | 40 | 41 | 40 |
| 29.12.2016 | 40 | 41 | 40 |
| 28.12.2016 | 41 | 41 | 40 |
| 27.12.2016 | 41 | 42 | 41 |
| 26.12.2016 | 42 | 42 | 42 |
| 25.12.2016 | 42 | 42 | 42 |
© Bayerisches Landesamt für Umwelt 2024