
- Start >
- Rivers >
- Waterlevel >
- Naab - Regen >
- Langenbruck >
- Chart of month

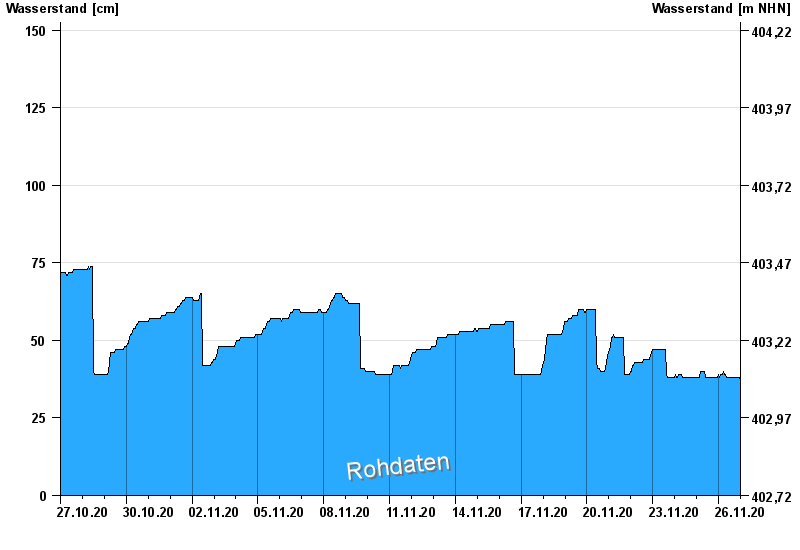
Chart of month Langenbruck / Frankenohe
Waterlevel from 27.10.2020 to 26.11.2020
- 26.01.1995 Wasserstand: 193 cm
- 21.12.1993 Wasserstand: 181 cm
- 14.01.2011 Wasserstand: 176 cm
- 03.01.2003 Wasserstand: 174 cm
- 01.03.1990 Wasserstand: 172 cm
| Date | Waterlevel [cm] |
|---|---|
| 26.11.2020 23:45 | 37 |
| 26.11.2020 23:30 | 37 |
| 26.11.2020 23:15 | 37 |
| 26.11.2020 23:00 | 37 |
| 26.11.2020 22:45 | 38 |
| 26.11.2020 22:30 | 38 |
| 26.11.2020 22:15 | 38 |
© Bayerisches Landesamt für Umwelt 2024