
- Start >
- Rivers >
- Waterlevel >
- Naab - Regen >
- Johannisthal >
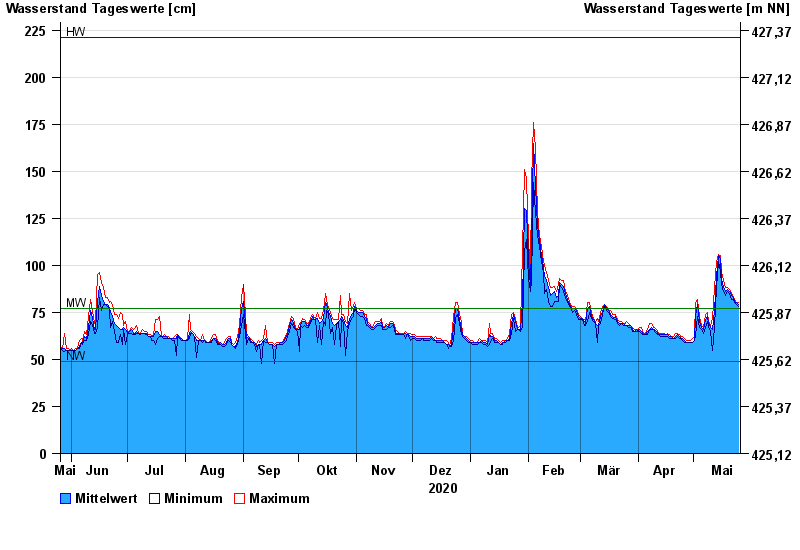
- Chart of year

Chart of year Johannisthal / Tirschenreuther Waldnaab
Waterlevel from 26.05.2020 to 25.05.2021
| Date | Mean value [cm] | Maximum [cm] | Minimum [cm] |
|---|---|---|---|
| 25.05.2021 | 79 | 80 | 78 |
| 24.05.2021 | 80 | 80 | 79 |
| 23.05.2021 | 81 | 82 | 80 |
| 22.05.2021 | 83 | 83 | 82 |
| 21.05.2021 | 84 | 85 | 82 |
| 20.05.2021 | 86 | 87 | 85 |
| 19.05.2021 | 87 | 88 | 86 |
© Bayerisches Landesamt für Umwelt 2024