
- Start >
- Rivers >
- Waterlevel >
- Naab - Regen >
- Johannisthal >
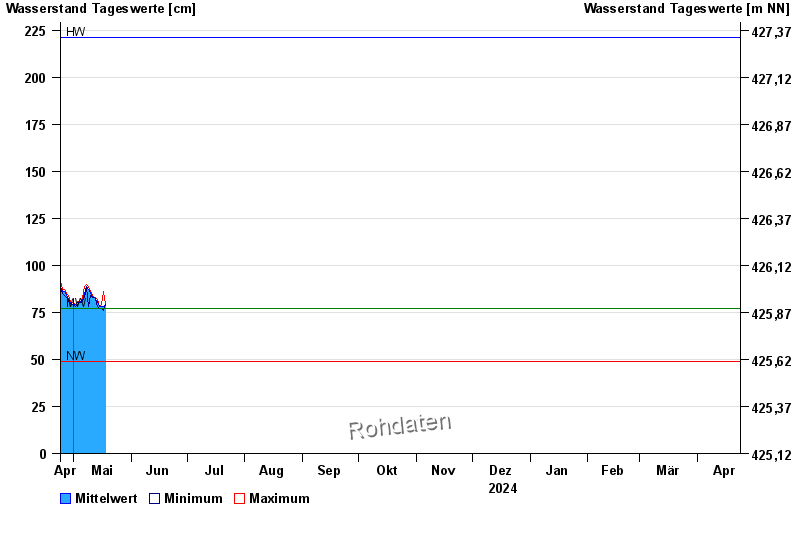
- Chart of year

Chart of year Johannisthal / Tirschenreuther Waldnaab
Waterlevel from 24.04.2024 to 23.04.2025
| Date | Mean value [cm] | Maximum [cm] | Minimum [cm] |
|---|---|---|---|
| 19.06.2024 | 84 | 84 | 83 |
| 18.06.2024 | 85 | 85 | 84 |
| 17.06.2024 | 84 | 101 | 63 |
| 16.06.2024 | 87 | 87 | 86 |
| 15.06.2024 | 86 | 87 | 85 |
| 14.06.2024 | 85 | 90 | 81 |
| 13.06.2024 | 86 | 86 | 85 |
© Bayerisches Landesamt für Umwelt 2024