
- Start >
- Rivers >
- Waterlevel >
- Naab - Regen >
- Hirschbach >
- Chart of total period

Chart of total period Hirschbach / Kleiner Regen
Waterlevel from 01.11.1976 to 26.04.2024
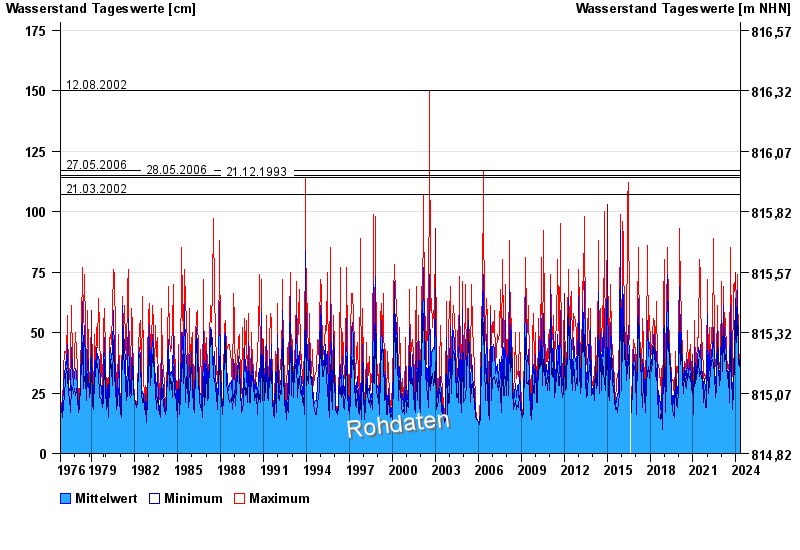
- 12.08.2002 Wasserstand: 150 cm
- 27.05.2006 Wasserstand: 117 cm
- 28.05.2006 Wasserstand: 115 cm
- 21.12.1993 Wasserstand: 114 cm
- 21.03.2002 Wasserstand: 107 cm
| Date | Mean value [cm] | Maximum [cm] | Minimum [cm] |
|---|---|---|---|
| 26.04.2024 | 33 | 34 | 32 |
| 25.04.2024 | 33 | 33 | 33 |
| 24.04.2024 | 33 | 33 | 33 |
| 23.04.2024 | 33 | 33 | 33 |
| 22.04.2024 | 33 | 34 | 33 |
| 21.04.2024 | 34 | 34 | 33 |
| 20.04.2024 | 33 | 33 | 33 |
© Bayerisches Landesamt für Umwelt 2024