
- Start >
- Rivers >
- Waterlevel >
- Naab - Regen >
- Gressenwöhr >
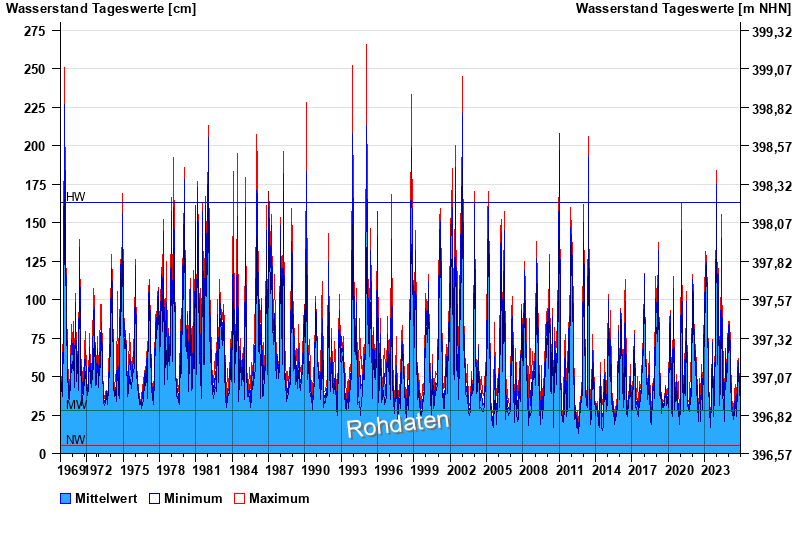
- Chart of total period

Chart of total period Gressenwöhr / Vils
Waterlevel from 01.11.1969 to 16.12.2025
note
Anstieg des Wasserstandes bedingt durch Biberdamm, Rückstau!
| Date | Mean value [cm] | Maximum [cm] | Minimum [cm] |
|---|---|---|---|
| 16.12.2025 | 26 | 26 | 25 |
| 15.12.2025 | 28 | 29 | 26 |
| 14.12.2025 | 26 | 30 | 25 |
| 13.12.2025 | 29 | 33 | 26 |
| 12.12.2025 | 28 | 32 | 27 |
| 11.12.2025 | 32 | 35 | 30 |
| 10.12.2025 | 33 | 38 | 32 |
© Bayerisches Landesamt für Umwelt 2025