
- Start >
- Rivers >
- Waterlevel >
- Naab - Regen >
- Grafenwöhr >
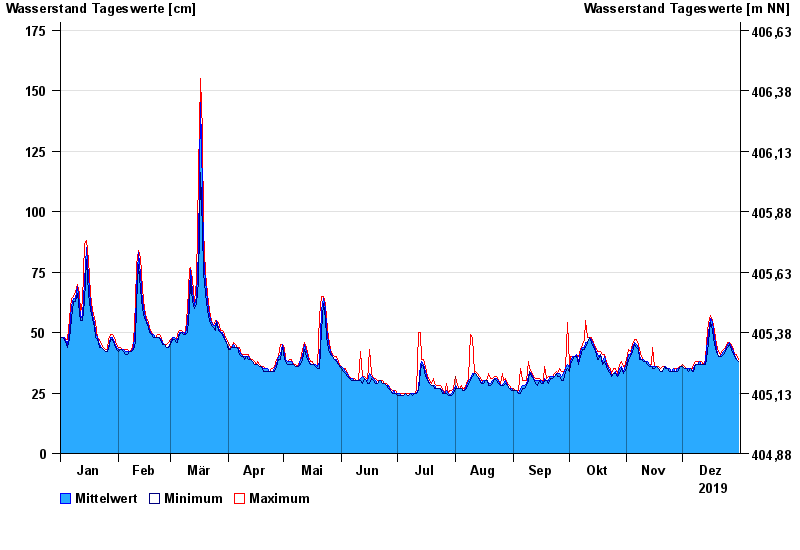
- Chart of year

Chart of year Grafenwöhr / Creußen
Waterlevel from 01.01.2019 to 31.12.2019
| Date | Mean value [cm] | Maximum [cm] | Minimum [cm] |
|---|---|---|---|
| 31.12.2019 | 38 | 39 | 38 |
| 30.12.2019 | 39 | 41 | 39 |
| 29.12.2019 | 41 | 41 | 40 |
| 28.12.2019 | 42 | 43 | 41 |
| 27.12.2019 | 44 | 45 | 43 |
| 26.12.2019 | 46 | 46 | 45 |
| 25.12.2019 | 45 | 46 | 44 |
© Bayerisches Landesamt für Umwelt 2024