
- Start >
- Rivers >
- Waterlevel >
- Naab - Regen >
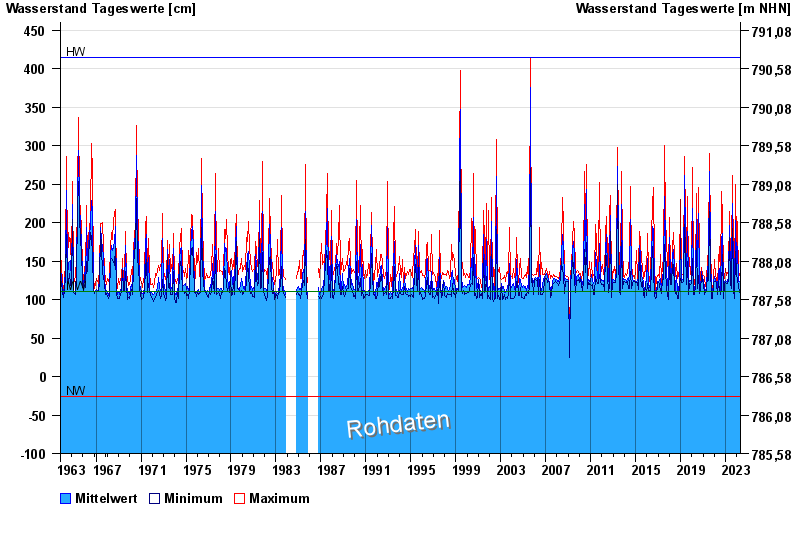
- Füssen >
- Chart of total period

Chart of total period Füssen / Lech
Waterlevel from 01.11.1963 to 29.04.2024
| Date | Mean value [cm] | Maximum [cm] | Minimum [cm] |
|---|---|---|---|
| 29.04.2024 | 113 | 119 | 109 |
| 28.04.2024 | 109 | 116 | 102 |
| 27.04.2024 | 106 | 112 | 102 |
| 26.04.2024 | 105 | 110 | 100 |
| 25.04.2024 | 105 | 111 | 99 |
| 24.04.2024 | 105 | 110 | 102 |
| 23.04.2024 | 104 | 107 | 101 |
© Bayerisches Landesamt für Umwelt 2024