
- Start >
- Rivers >
- Waterlevel >
- Naab - Regen >
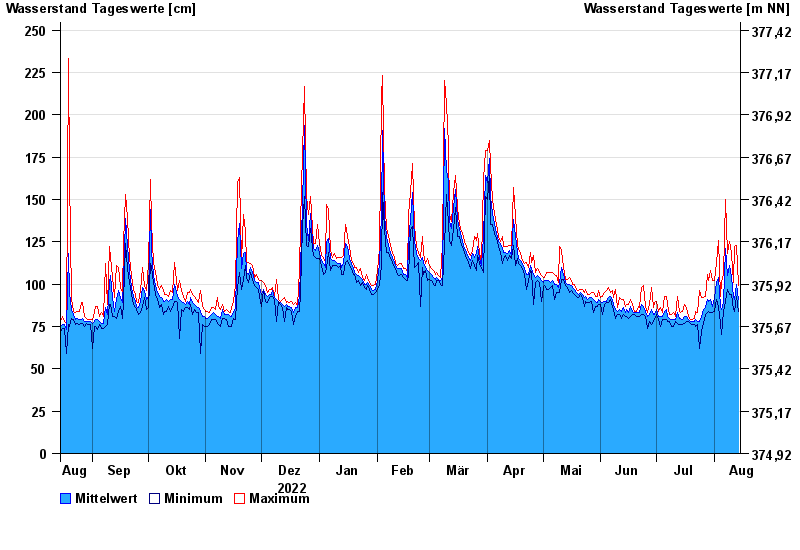
- Fronhof >
- Chart of year

Chart of year Fronhof / Murach
Waterlevel from 15.08.2022 to 14.08.2023
- 03.06.2013 Wasserstand: 312 cm
- 26.01.1995 Wasserstand: 304 cm
- 13.02.2005 Wasserstand: 301 cm
- 21.12.1993 Wasserstand: 301 cm
- 13.01.2011 Wasserstand: 297 cm
| Date | Mean value [cm] | Maximum [cm] | Minimum [cm] |
|---|---|---|---|
| 14.08.2023 | 91 | 99 | 84 |
| 13.08.2023 | 100 | 123 | 93 |
| 12.08.2023 | 91 | 122 | 84 |
| 11.08.2023 | 92 | 101 | 85 |
| 10.08.2023 | 104 | 118 | 94 |
| 09.08.2023 | 111 | 125 | 94 |
| 08.08.2023 | 105 | 118 | 97 |
© Bayerisches Landesamt für Umwelt 2024