
- Start >
- Rivers >
- Waterlevel >
- Naab - Regen >
- Fronhof >
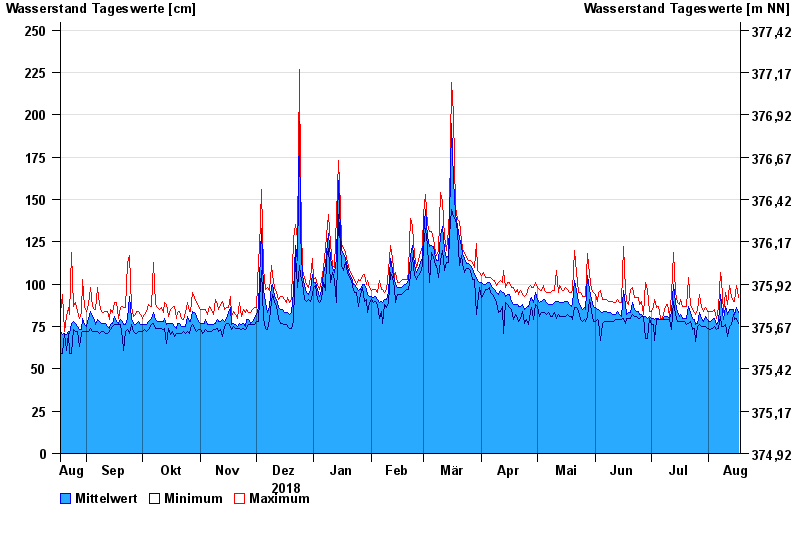
- Chart of year

Chart of year Fronhof / Murach
Waterlevel from 18.08.2018 to 17.08.2019
| Date | Mean value [cm] | Maximum [cm] | Minimum [cm] |
|---|---|---|---|
| 17.08.2019 | 83 | 92 | 77 |
| 16.08.2019 | 86 | 99 | 80 |
| 15.08.2019 | 82 | 90 | 79 |
| 14.08.2019 | 85 | 90 | 82 |
| 13.08.2019 | 85 | 93 | 76 |
| 12.08.2019 | 85 | 99 | 75 |
| 11.08.2019 | 82 | 88 | 69 |
© Bayerisches Landesamt für Umwelt 2024