
- Start >
- Rivers >
- Waterlevel >
- Naab - Regen >
- Fronhof >
- Chart of year

Chart of year Fronhof / Murach
Waterlevel from 13.08.2021 to 12.08.2022
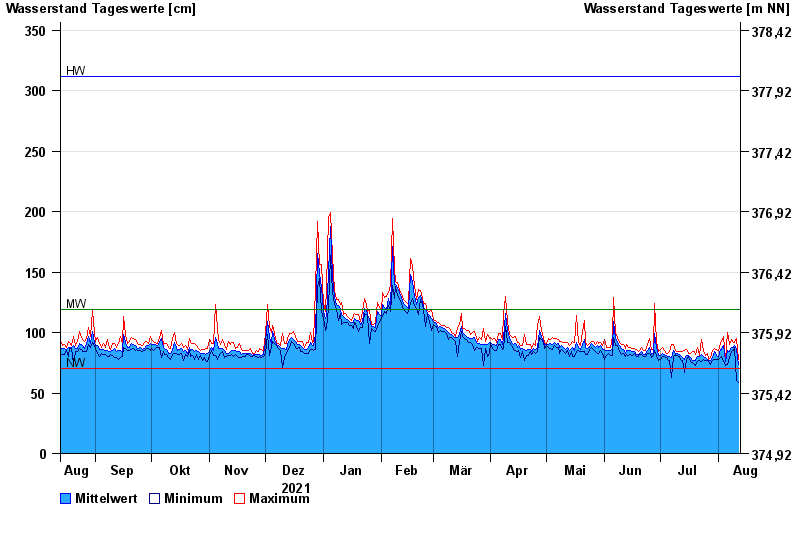
| Date | Mean value [cm] | Maximum [cm] | Minimum [cm] |
|---|---|---|---|
| 12.08.2022 | 74 | 78 | 59 |
| 11.08.2022 | 86 | 95 | 60 |
| 10.08.2022 | 89 | 92 | 88 |
| 09.08.2022 | 88 | 92 | 85 |
| 08.08.2022 | 88 | 94 | 84 |
| 07.08.2022 | 84 | 90 | 79 |
| 06.08.2022 | 85 | 100 | 74 |
© Bayerisches Landesamt für Umwelt 2024