
- Start >
- Rivers >
- Waterlevel >
- Naab - Regen >
- Eschlkam >
- Chart of year

Chart of year Eschlkam / Chamb
Waterlevel from 30.03.2024 to 29.03.2025
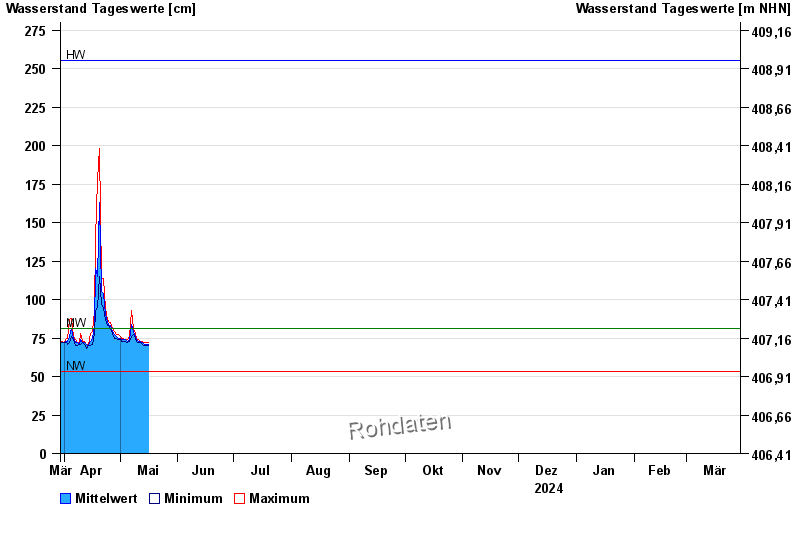
| Date | Mean value [cm] | Maximum [cm] | Minimum [cm] |
|---|---|---|---|
| 05.06.2024 | 167 | 179 | 156 |
| 04.06.2024 | 203 | 221 | 179 |
| 03.06.2024 | 236 | 255 | 221 |
| 02.06.2024 | 241 | 265 | 233 |
| 01.06.2024 | 234 | 247 | 162 |
| 31.05.2024 | 101 | 155 | 92 |
| 30.05.2024 | 95 | 99 | 92 |
© Bayerisches Landesamt für Umwelt 2024