
- Start >
- Rivers >
- Waterlevel >
- Unterer Main >
- Unterweißenbrunn >
- Chart of total period

Chart of total period Unterweißenbrunn / Brend
Waterlevel from 01.11.1976 to 29.04.2024
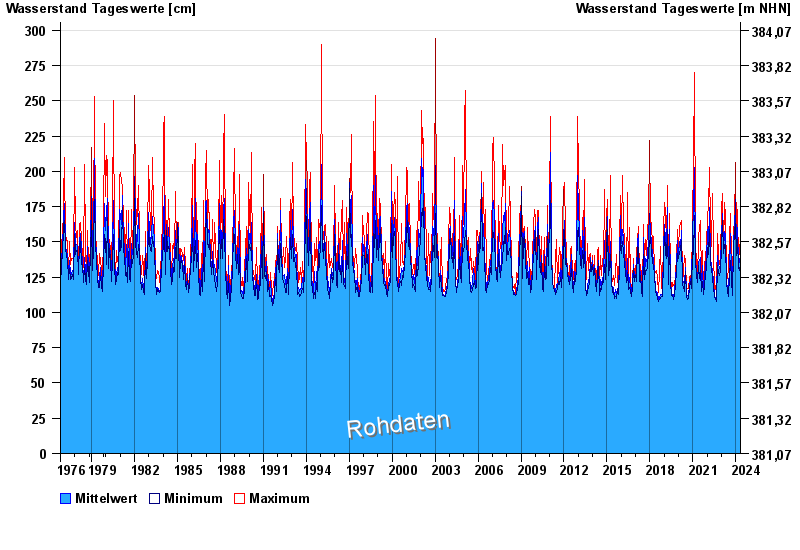
| Date | Mean value [cm] | Maximum [cm] | Minimum [cm] |
|---|---|---|---|
| 29.04.2024 | 123 | 123 | 123 |
| 28.04.2024 | 124 | 125 | 123 |
| 27.04.2024 | 126 | 127 | 125 |
| 26.04.2024 | 127 | 128 | 127 |
| 25.04.2024 | 128 | 129 | 128 |
| 24.04.2024 | 129 | 129 | 128 |
| 23.04.2024 | 130 | 131 | 129 |
© Bayerisches Landesamt für Umwelt 2024