
- Start >
- Rivers >
- Waterlevel >
- Unterer Main >
- Trunstadt >
- Chart of year

Chart of year Trunstadt / Main
Waterlevel from 29.03.2024 to 28.03.2025
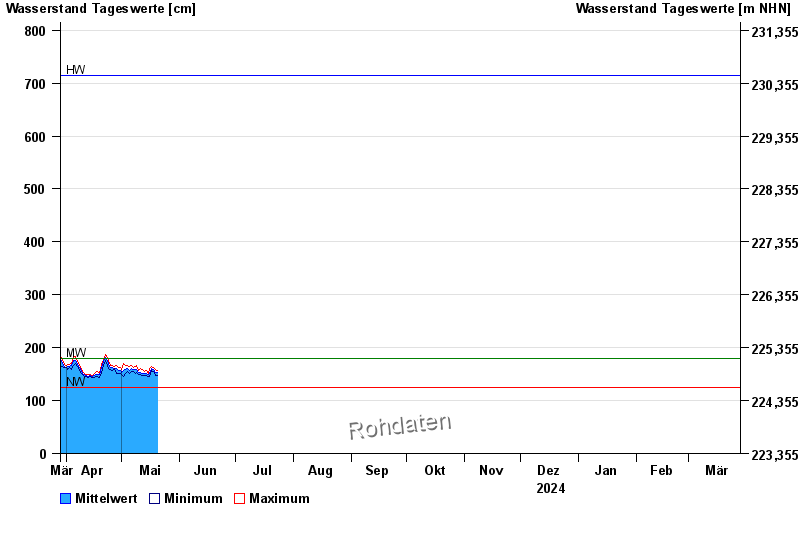
| Date | Mean value [cm] | Maximum [cm] | Minimum [cm] |
|---|---|---|---|
| 10.05.2024 | 155 | 155 | 154 |
| 09.05.2024 | 159 | 167 | 153 |
| 08.05.2024 | 159 | 165 | 152 |
| 07.05.2024 | 159 | 163 | 155 |
| 06.05.2024 | 161 | 167 | 155 |
| 05.05.2024 | 157 | 165 | 151 |
| 04.05.2024 | 161 | 167 | 155 |
© Bayerisches Landesamt für Umwelt 2024