
- Start >
- Rivers >
- Waterlevel >
- Unterer Main >
- Trunstadt >
- Chart of year

Chart of year Trunstadt / Main
Waterlevel from 20.04.2024 to 19.04.2025
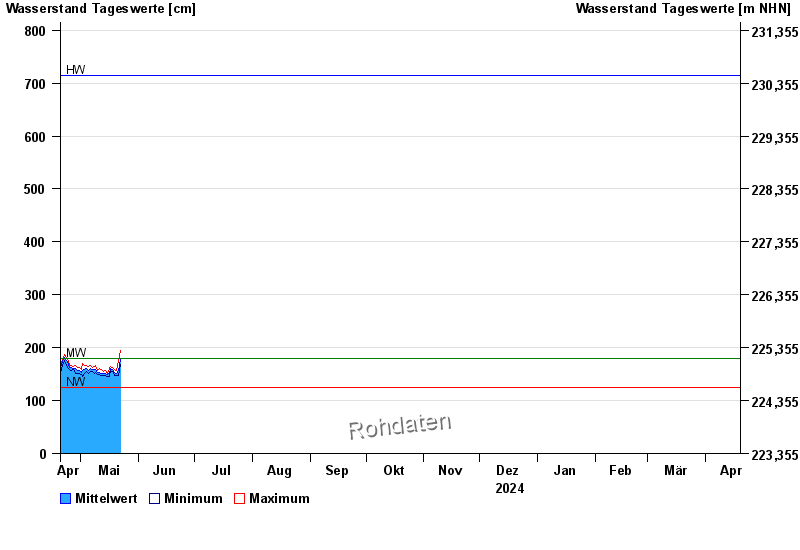
| Date | Mean value [cm] | Maximum [cm] | Minimum [cm] |
|---|---|---|---|
| 22.05.2024 | 181 | 199 | 168 |
| 21.05.2024 | 156 | 175 | 148 |
| 20.05.2024 | 152 | 157 | 148 |
| 19.05.2024 | 154 | 159 | 148 |
| 18.05.2024 | 158 | 162 | 155 |
| 17.05.2024 | 160 | 165 | 156 |
| 16.05.2024 | 151 | 161 | 146 |
© Bayerisches Landesamt für Umwelt 2024