
- Start >
- Rivers >
- Waterlevel >
- Unterer Main >
- Scheinfeld >
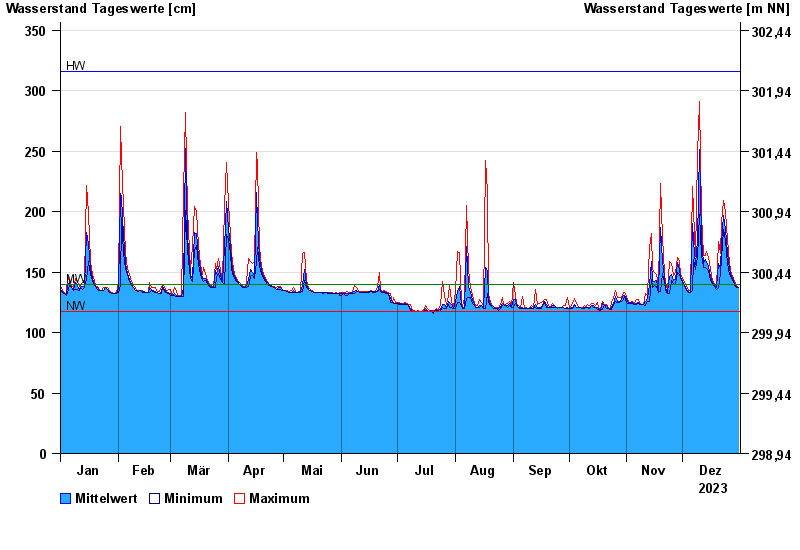
- Chart of year

Chart of year Scheinfeld / Scheine
Waterlevel from 01.01.2023 to 31.12.2023
note
Datenübertragung Geber 1 fällt zeitweise aus.
| Date | Mean value [cm] | Maximum [cm] | Minimum [cm] |
|---|---|---|---|
| 31.12.2023 | 137 | 137 | 137 |
| 30.12.2023 | 138 | 139 | 137 |
| 29.12.2023 | 140 | 142 | 139 |
| 28.12.2023 | 143 | 145 | 142 |
| 27.12.2023 | 146 | 148 | 145 |
| 26.12.2023 | 152 | 157 | 148 |
| 25.12.2023 | 165 | 177 | 157 |
© Bayerisches Landesamt für Umwelt 2025