
- Start >
- Rivers >
- Waterlevel >
- Unterer Main >
- Scheinfeld >
- Chart of year

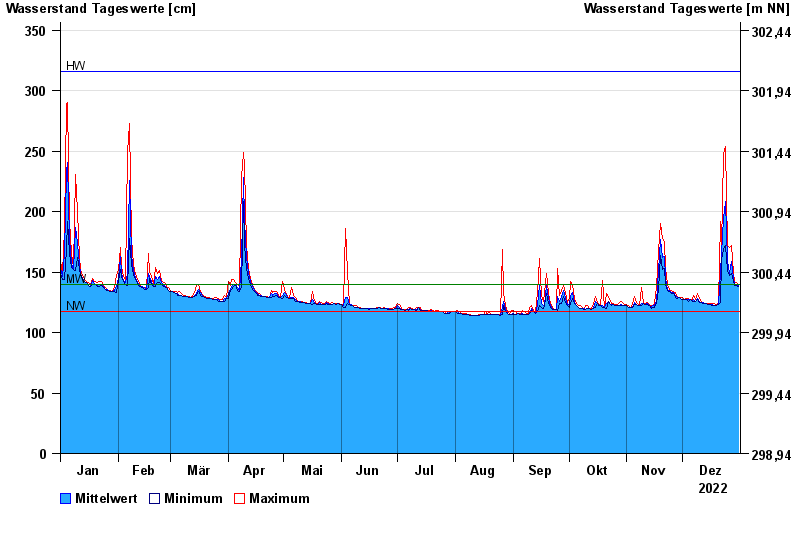
Chart of year Scheinfeld / Scheine
Waterlevel from 01.01.2022 to 31.12.2022
| Date | Mean value [cm] | Maximum [cm] | Minimum [cm] |
|---|---|---|---|
| 31.12.2022 | 139 | 140 | 138 |
| 30.12.2022 | 140 | 141 | 139 |
| 29.12.2022 | 140 | 142 | 139 |
| 28.12.2022 | 145 | 149 | 142 |
| 27.12.2022 | 159 | 172 | 149 |
| 26.12.2022 | 149 | 170 | 147 |
| 25.12.2022 | 159 | 172 | 151 |
© Bayerisches Landesamt für Umwelt 2024