
- Start >
- Rivers >
- Waterlevel >
- Unterer Main >
- Rosenheim o.d. Mangfallmündung >
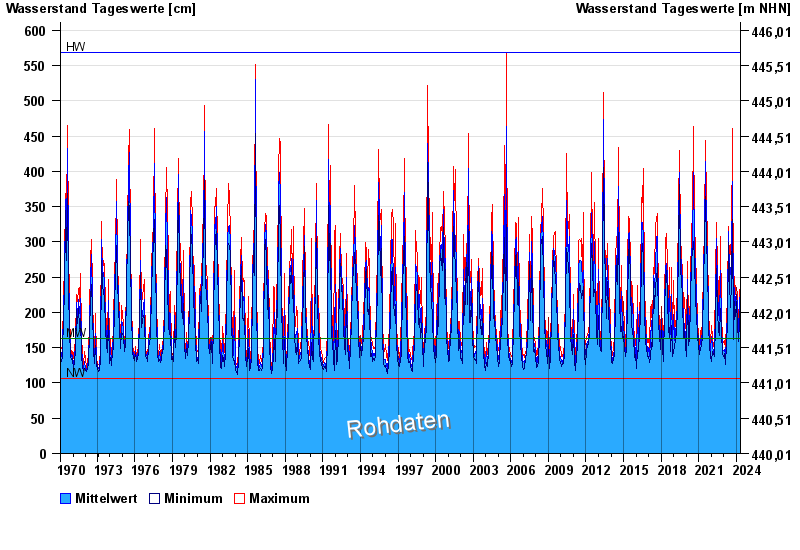
- Chart of total period

Chart of total period Rosenheim o.d. Mangfallmündung / Inn
Waterlevel from 26.01.1970 to 29.04.2024
| Date | Mean value [cm] | Maximum [cm] | Minimum [cm] |
|---|---|---|---|
| 29.04.2024 | 157 | 168 | 152 |
| 28.04.2024 | 155 | 170 | 142 |
| 27.04.2024 | 156 | 161 | 153 |
| 26.04.2024 | 147 | 154 | 138 |
| 25.04.2024 | 154 | 161 | 149 |
| 24.04.2024 | 160 | 169 | 153 |
| 23.04.2024 | 166 | 176 | 160 |
© Bayerisches Landesamt für Umwelt 2024