
- Start >
- Rivers >
- Waterlevel >
- Unterer Main >
- Pfarrweisach >
- Chart of total period

Chart of total period Pfarrweisach / Weisach
Waterlevel from 01.11.1971 to 26.04.2024
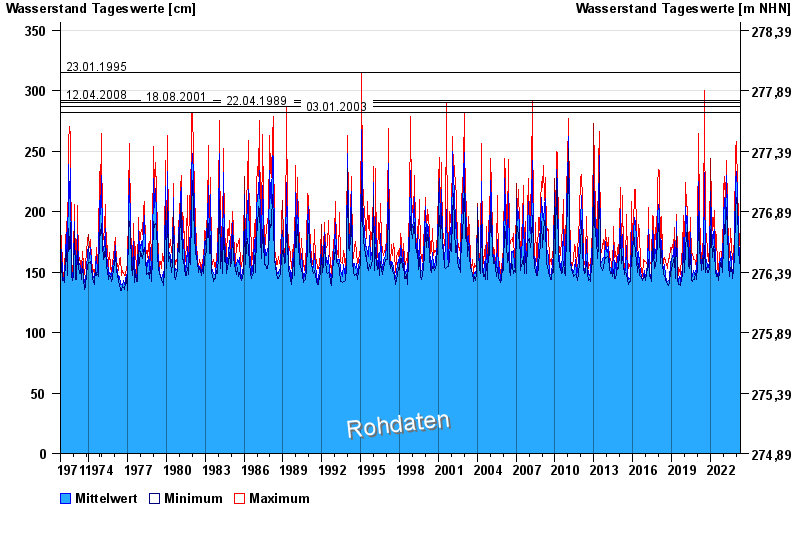
- 23.01.1995 Wasserstand: 315 cm
- 12.04.2008 Wasserstand: 292 cm
- 18.08.2001 Wasserstand: 290 cm
- 22.04.1989 Wasserstand: 287 cm
- 03.01.2003 Wasserstand: 282 cm
| Date | Mean value [cm] | Maximum [cm] | Minimum [cm] |
|---|---|---|---|
| 26.04.2024 | 153 | 153 | 152 |
| 25.04.2024 | 153 | 154 | 153 |
| 24.04.2024 | 154 | 154 | 154 |
| 23.04.2024 | 155 | 156 | 154 |
| 22.04.2024 | 159 | 164 | 157 |
| 21.04.2024 | 165 | 171 | 156 |
| 20.04.2024 | 159 | 165 | 156 |
© Bayerisches Landesamt für Umwelt 2024